개요
- 본 코드는 다음 유투브 영상에서 다룬 내용 중 다루지 못한 내용을 추가한 블로그입니다.
Youtube
- 유투브 영상은 다음과 같습니다. 전체 강의자료 및 데이터셋은 udemy 또는 inflern에서 확인 가능합니다.
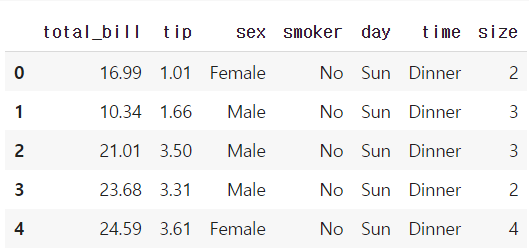
가상의 데이터셋 생성
- 먼저 라이브러리를 불러온 후, 가상의 데이터셋을 만듭니다.
import matplotlib.pyplot as plt
import pandas as pd
import numpy as np
years = [2007, 2008]
months = ['1', '2', '3', '4', '5', '6', '7', '8', '9', '10', '11', '12']
np.random.seed(0) # For reproducibility
data = {
'year': np.repeat(years, 12),
'month': months * 2,
'house_prices': np.random.randint(100, 500, 24)
}
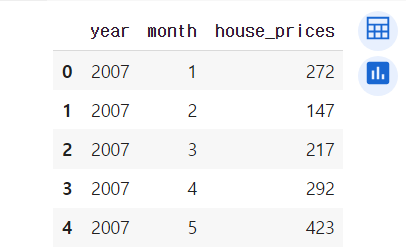
df_random = pd.DataFrame(data)
- 데이터셋은 크게 year, month, house_prices로 구성되어 있습니다.