강의 홍보
개요
- 보안 로그 파일을 업로드한 뒤, 점검 결과를 자동으로 출력해주도록 한다.
- (수강생의 도전) 보안 로그 파일을 업로드 한 뒤, CPU 사용률이 70%가 넘으면 경고 메시지를 뛰우도록 한다.
Chapter 1. 로그데이터 분석 및 확인
- 먼저 CPU가 들어있는 로그데이터를 확인한다.
- 골든시스에서 제공한 Sample 데이터를 근거로 랜덤하게 데이터를 생성했다. 파일명:
(cpu_test.txt)
Dorm_E_116.95#
Dorm_E_116.95#sh logg
Dorm_E_116.95#sh logging
Syslog logging: enabled (0 messages dropped, 1 messages rate-limited, 0 flushes, 0 overruns, xml disabled, filtering disabled)

No Active Message Discriminator.

No Inactive Message Discriminator.

    Console logging: level debugging, 2178 messages logged, xml disabled,
                     filtering disabled
    Monitor logging: level debugging, 244 messages logged, xml disabled,
                     filtering disabled
    Buffer logging:  level debugging, 2178 messages logged, xml disabled,
                    filtering disabled
    Exception Logging: size (4096 bytes)
    Count and timestamp logging messages: disabled
    File logging: disabled
    Persistent logging: disabled

No active filter modules.

    Trap logging: level informational, 2176 message lines logged
        Logging Source-Interface:       VRF Name:

Log Buffer (100000 bytes):
17:19:23: %PM-4-ERR_DISABLE: storm-control error detected on Gi1/0/36, putting Gi1/0/36 in err-disable state
Jul  7 17:19:23: %STORM_CONTROL-3-SHUTDOWN: A packet storm was detected on Gi1/0/36. The interface has been disabled.
Jul  7 17:19:25: %LINK-3-UPDOWN: Interface GigabitEthernet1/0/36, changed state to down
Jul  7 17:19:53: %PM-4-ERR_RECOVER: Attempting to recover from storm-control err-disable state on Gi1/0/36
Switch#show processor cpu
CPU utilization for five seconds: 4%/1%; one minute: 3%; five minutes: 3%
.
.
.
- 업무 수행 시, 위와 같은 데이터를 생성한다. 그 후에, 점검일지 파일을 작성한다.
- 점검일지 파일 Sample
/img/programming/2021/08/dash_cpu_logdata/log_01.png
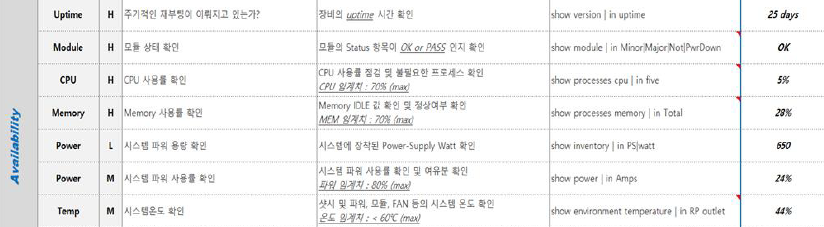
(1) 문제점 진단
- 통상적으로 위와 같이 명령어를 입력한 뒤 결괏값을 찾아 수기로 입력하여 작성하도록 함
- 일일이 확인해야 하는 번거로움이 있다보니, 이를 자동으로 처리할 수 있는 툴 제작 의뢰를 받음
(2) 해결방안
- 명령어 및 결괏값이 일정한 패턴이 있기 때문에, 문자열 매칭을 통해 전처리가 가능한 것을 확인
- 또한, Dash 프레임워크를 통해 비교적 간단하게 대시보드를 만들 수 있음에 착안하였다.
(3) 배경지식
- 보안 관련 명령어 지식이 필요할 수도 있어서, 공유한다.
Chapter 2. 문자열 전처리 함수 만들기
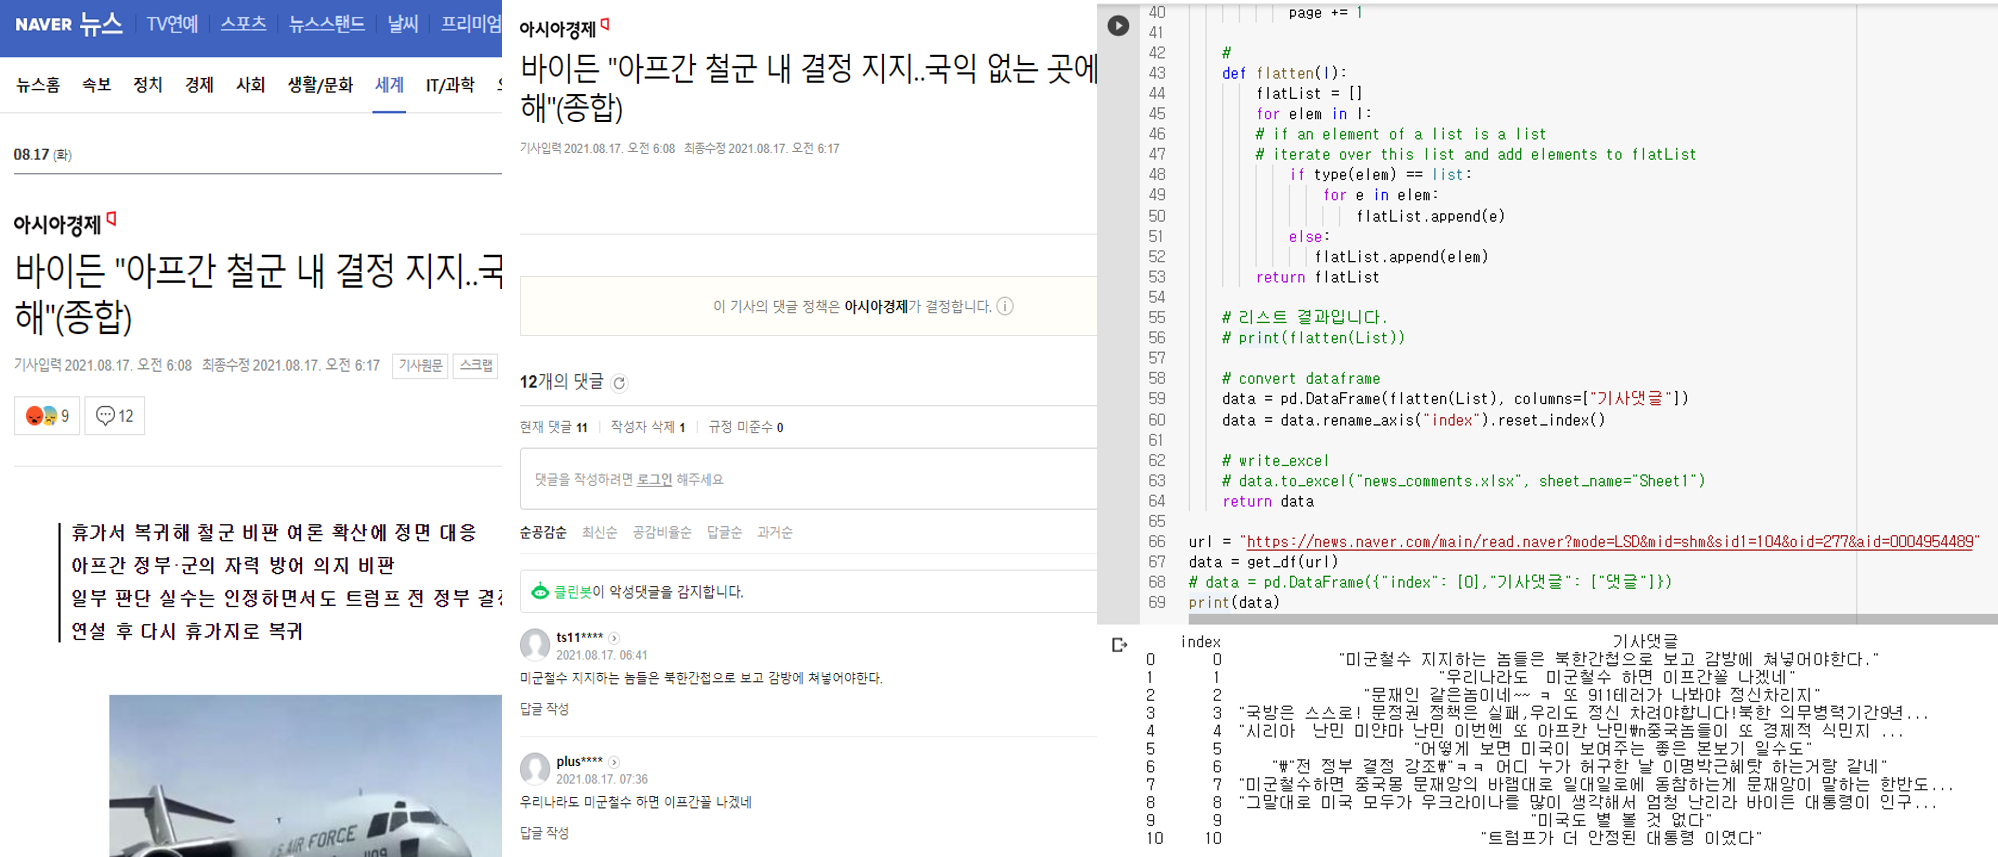
- 우선 Jupyter Lab에서 간단한 테스트 함수를 만들어 보았다.
- 전체 코드는 아래와 같다.
- 파일을 불러온 뒤 우선 각 코드 라인 중에서
CPU utilization 가 있는 텍스트만 남기고 그 외에는 모두 삭제한다. - 여기에서 다른 명령어의 결괏값을 확인하다면, if else 구문으로 계속적으로 확장할 수 있을 것이다.
- 그 후에, 각 re.sub 함수를 활용하여 수치만 뽑아낸다.
- 이를 각 데이터 프레임에 추가한 것이다.
import pandas as pd
import re

def text_cleanser(FILE_PATH):
    with open(FILE_PATH, 'r') as f:
        logLines = f.read().splitlines()
    cleaned_lines = [x for x in logLines if "CPU utilization" in x]
    clean_text = re.sub('/[0-9]%', '', cleaned_lines[0])
    print("temp:", clean_text)
    result_list = re.findall("\d+", clean_text)
    return result_list

FILE_PATH = "data/cpu_test.txt"
result_list = text_cleanser(FILE_PATH)
result_list
- 위 파일을 Jupyter lab에서 실행하면 아래와 같은 결괏값이 출력될 것이다.
temp: CPU utilization for five seconds: 4%; one minute: 3%; five minutes: 3%
['4', '3', '3']
- 출력한 결과물을 pandas 데이터 프레임에 적용한 결과는 아래와 같다.
data = pd.DataFrame({"분류":["cpu"],
                     "점검내용": ["CPU 사용률 점검 및 불필요한 프로세스 확인"],
                     "점검기준": ["MEM 임계치: 70% (MAX)"],
                     "점검방법": ["show processes cpu | in five"],
                     "5초 동안 CPU 사용률": [result_list[0]],
                     "1분 동안 CPU 사용률": [result_list[1]],
                     "5분 동안 CPU 사용률": [result_list[2]],
                    })
data