Corona Shiny Project 3 - Visusalization (Bubble Chart)
공지
이번에 준비한 튜토리얼은 제 강의를 듣는 과거-현재-미래 수강생분들을 위해 준비한 자료이다. 많은 도움이 되기를 바란다
이번에 준비한 Tutorial 코로나 세계현황을 Shiny Dashboard로 만들어 가는 과정을 담았다.
I. Shiny Tutorial 소개
처음 shiny를 접하거나 shiny의 전체 튜토리얼이 궁금한 사람들을 위해 이전 글을 소개한다.
- shiny tutorial 01 - get started
- shiny tutorial 02 - Shiny Structure
- shiny tutorial 03 - HTML content
- shiny tutorial 04 - Shiny Layouts
- shiny tutorial 05 - Sharing Apps
- shiny tutorial 06 - shinydashboard
- shiny tutorial 07 - flexdashboard
- shiny tutorial 08 - HTML, CSS 적용
II. Shiny Project
현재 진행중인 프로젝트가 궁금하다면 아래를 확인해보자.
III. Bubble Chart
뉴스 기사를 접하면, 버블차트가 그려진 기사를 접하게 될 것이다. 아래 이미지가 말하는 것은 매우 선명하다.

이러한 버블차트가 산점도와 만나면 훨씬 더 분명하게 메시지를 던질 수 있다.

소득과 건강과 관련된 그래프를 인구수에 비례하여 어느정도 상관이 있는지를 보여준다. Bubble Chart는 이렇게 기존의 2차원의 산점도에서 3차원까지 확장해서 보여준다는 큰 의미가 있다.
이 그래프를 우선적으로 작성한 뒤, Shiny App에 배포하도록 한다.
(1) 그래프 작성의 목적
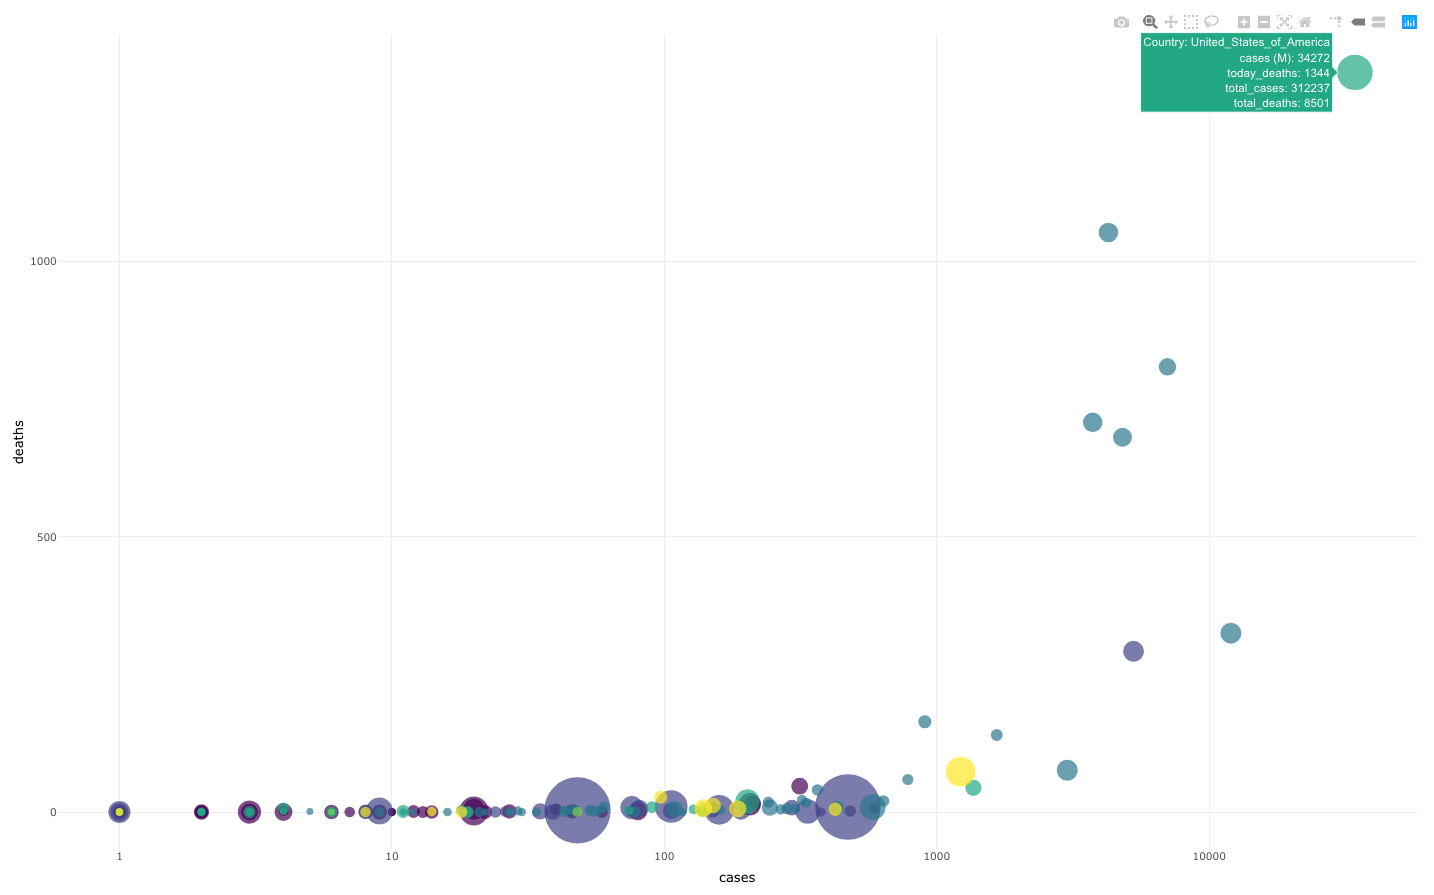
우선 확진자(cases)와 사망자(deaths)의 상관관계를 그리되, 인구수를 Bubble로 치환할 것이다. Sample로 2020-04-05 기준으로 우선 처리해서 시각화로 만들어 보자.
IV. Practice in R Editor
(1) 패키지 로드
시각화에 필요한 패키지는 아래와 같다.
library(plotly)    # 동적 시각화
library(viridis)   # 색상 관련 패키지
library(readxl)    # 엑셀파일 데이터 수집
library(tidyverse) # 데이터 가공 및 ggplot2 시각화
(2) 데이터 가져오기
지난 시간에는 SQL DB를 통해서 소스코드를 가져왔다면, 이번에는 엑셀파일을 통해서 데이터를 가져오도록 하자.
library(readxl)

# get covid data
corona <- read_excel("your_corona_file_path", sheet = 1) %>%
  mutate(dateRep = as.Date(dateRep))

Rows: 8,905
Columns: 10
$ dateRep                 <date> 2020-04-05, 2020-04-04, 2020-04-03, 2020…
$ day                     <dbl> 5, 4, 3, 2, 1, 31, 30, 29, 28, 27, 26, 25…
$ month                   <dbl> 4, 4, 4, 4, 4, 3, 3, 3, 3, 3, 3, 3, 3, 3,…
$ year                    <dbl> 2020, 2020, 2020, 2020, 2020, 2020, 2020,…
$ cases                   <dbl> 35, 0, 43, 26, 25, 27, 8, 15, 16, 0, 33, …
$ deaths                  <dbl> 1, 0, 0, 0, 0, 0, 1, 1, 1, 0, 0, 0, 1, 0,…
$ countriesAndTerritories <chr> "Afghanistan", "Afghanistan", "Afghanista…
$ geoId                   <chr> "AF", "AF", "AF", "AF", "AF", "AF", "AF",…
$ countryterritoryCode    <chr> "AFG", "AFG", "AFG", "AFG", "AFG", "AFG",…
$ popData2018             <dbl> 37172386, 37172386, 37172386, 37172386, 3…
위와 같은 형태의 데이터 셋이 출력되면 정상이다.
- 두번째로 작업해야 하는 것은
Continent Code가 필요하다.Continent Code를 통해서country를 그룹화 해야 하기 때문에Table Join도 필요하다.
# get code data
url <- 'https://pkgstore.datahub.io/JohnSnowLabs/country-and-continent-codes-list/country-and-continent-codes-list-csv_csv/data/b7876b7f496677669644f3d1069d3121/country-and-continent-codes-list-csv_csv.csv'

# Country Code 변수명 재정의
country_code <- read.csv(url, stringsAsFactors = FALSE) %>%
  select(Continent_Name, Three_Letter_Country_Code) %>%
  rename(continent_code = Three_Letter_Country_Code)

# Covid_19 변수명 재정의
corona %>%
  rename(date = dateRep,
         country = countriesAndTerritories,
         continent_code = countryterritoryCode) -> corona2

# continent_code 변수 기준으로 데이터 통합
corona3 <- left_join(corona2, country_code)

# 결과 확인
glimpse(corona3)

Rows: 9,339
Columns: 11
$ date           <date> 2020-04-05, 2020-04-04, 2020-04-03, 2020-04-02, 2…
$ day            <dbl> 5, 4, 3, 2, 1, 31, 30, 29, 28, 27, 26, 25, 24, 23,…
$ month          <dbl> 4, 4, 4, 4, 4, 3, 3, 3, 3, 3, 3, 3, 3, 3, 3, 3, 3,…
$ year           <dbl> 2020, 2020, 2020, 2020, 2020, 2020, 2020, 2020, 20…
$ cases          <dbl> 35, 0, 43, 26, 25, 27, 8, 15, 16, 0, 33, 2, 6, 10,…
$ deaths         <dbl> 1, 0, 0, 0, 0, 0, 1, 1, 1, 0, 0, 0, 1, 0, 0, 0, 0,…
$ country        <chr> "Afghanistan", "Afghanistan", "Afghanistan", "Afgh…
$ geoId          <chr> "AF", "AF", "AF", "AF", "AF", "AF", "AF", "AF", "A…
$ continent_code <chr> "AFG", "AFG", "AFG", "AFG", "AFG", "AFG", "AFG", "…
$ popData2018    <dbl> 37172386, 37172386, 37172386, 37172386, 37172386, …
$ Continent_Name <chr> "Asia", "Asia", "Asia", "Asia", "Asia", "Asia", "A…
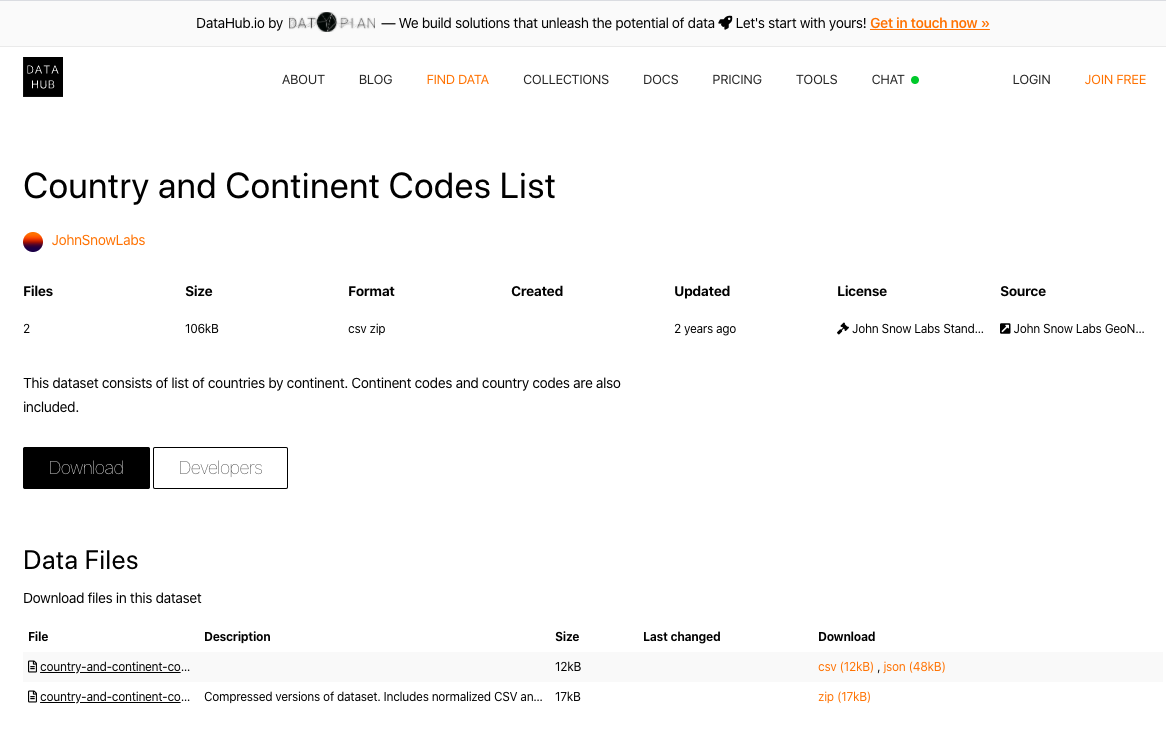
- 국가별 Code 데이터는 datahub.io에서 가져으니 참고하기를 바란다.
- (만약, 위 주소에 문제가 생기면 강사에게 개별 컨택하면 데이터가 보관된 제 개인
github url을 공유해주겠다.)
- (만약, 위 주소에 문제가 생기면 강사에게 개별 컨택하면 데이터가 보관된 제 개인

(3) 데이터 요약
데이터 요약을 할 때, 고려할 사항 중의 하나는 누적 데이터다. 날짜로 filtering을 할 때 해당 기간까지의 누적 확진자수와 누적 사망자수도 같이 계산하는 소스코드를 진행했다.
data <- corona3 %>%

  # cty_code가 없는 데이터는 삭제했다. 원래는 찾아서 개별 국가와 통합하는게 맞기는 하지만.. (숙제로 남겨둔다!)
  filter(date <= "2020-04-05", !is.na(cty_code)) %>%
  select(-c(day, month, year, geoId)) %>%
  # Reorder countries to having big bubbles on top
  arrange(date) %>%

  # 아래 코드가 누적수치를 뽑을 때 쓰는 방법이니 참고한다.
  group_by(country) %>%
  mutate(cum_cases = cumsum(cases),
         cum_deaths = cumsum(deaths)) %>%
  # plotly에서 표시 될 데이터 정보
  mutate(text = paste("Country: ", country, "\ncases (M): ", cases, "\ntoday_deaths: ", deaths, "\ntotal_cases: ", cum_cases, "\ntotal_deaths: ", cum_deaths, sep="")) %>%
  filter(date == "2020-04-05") %>%

  # 같은 국가명인데, 다른 대륙으로 묶인 경우가 있었다.
  # cases & deaths는 똑같아서, 중복값 처리 했다.
  distinct(date, cases, deaths, country, .keep_all = TRUE)

glimpse(data)

Rows: 198
Columns: 10
Groups: country [198]
$ date           <date> 2020-04-05, 2020-04-05, 2020-04-05, 2020-04-05, 2…
$ cases          <dbl> 35, 29, 27, 314, 2, 0, 186, 34, 2, 139, 241, 78, 4…
$ deaths         <dbl> 1, 2, 1, 47, 0, 0, 6, 0, 0, 4, 18, 0, 1, 0, 2, 0, …
$ country        <chr> "Afghanistan", "Albania", "Andorra", "Algeria", "A…
$ cty_code       <chr> "AFG", "ALB", "AND", "DZA", "AGO", "ATG", "ARG", "…
$ popData2018    <dbl> 37172386, 2866376, 77006, 42228429, 30809762, 9628…
$ Continent_Name <chr> "Asia", "Europe", "Europe", "Africa", "Africa", "N…
$ cum_cases      <dbl> 270, 333, 466, 1300, 10, 15, 1451, 1506, 64, 5687,…
$ cum_deaths     <dbl> 5, 19, 17, 130, 2, 0, 43, 14, 0, 34, 186, 10, 4, 4…
$ text           <chr> "Country: Afghanistan\ncases (M): 35\ntoday_deaths…
이제 데이터 가공 및 요약이 끝이났다. 시각화만 남았다. 시각화는 ggplot2로 개발한 뒤에, ggplotly()에서 담아서 출력한다.
p <- ggplot(data, aes(x=cases, y=deaths, size = popData2018, color = Continent_Name, text=text)) +
  geom_point(alpha=0.7) +

  # x값에 로그를 준 이유는? 극단적인 이상치가 발생되어 전체적인 흐름 확인하기가 어려웠다.
  scale_x_log10() +
  scale_size(range = c(1.4, 19), name="Population (M)") +
  scale_color_viridis(discrete=TRUE, guide=FALSE) +
  theme_minimal() +
  theme(legend.position="none")

pp <- ggplotly(p, tooltip="text")
pp

위 그림이 나오면 성공이다. 이제 R Markdown에서 응용하는 소스코드를 만들어보자.
V. Apply to R Markdown
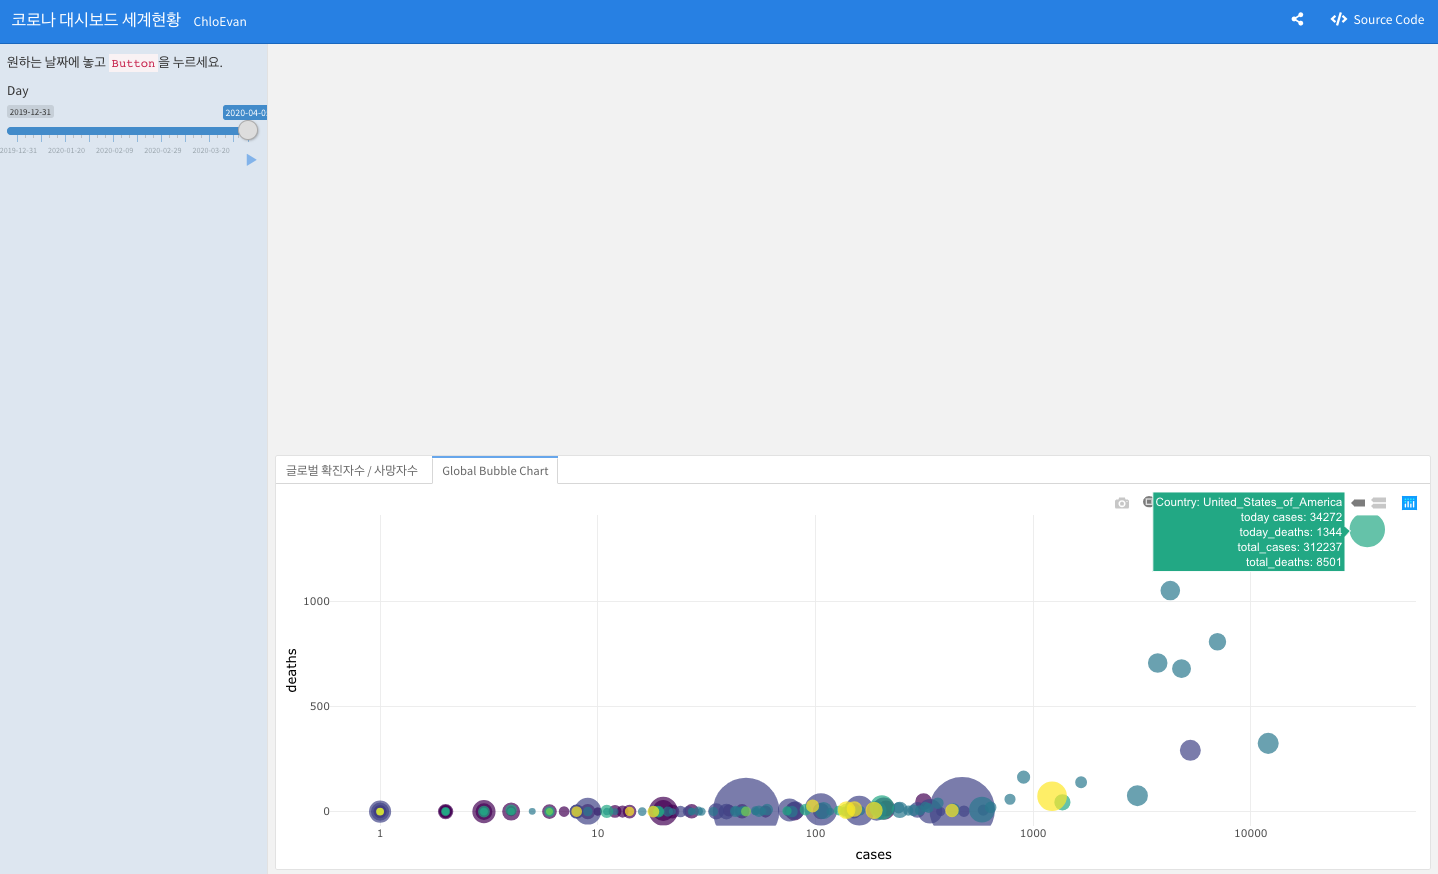
Global Bubble Chart 탭에 해당하는 소스코드를 찾아서 아래와 같이 입력하고 실행한다.
# Create data Reactive
corona_bubble_df <- reactive({
  corona3 %>%
  filter(date <= "2020-04-05", !is.na(cty_code)) %>%
  select(-c(day, month, year, geoId)) %>%
  # Reorder countries to having big bubbles on top
  arrange(date) %>%
  group_by(country) %>%
  mutate(cum_cases = cumsum(cases),
         cum_deaths = cumsum(deaths)) %>%
  # prepare text for tooltip
  mutate(text = paste("Country: ", country, "\ntoday cases: ", cases, "\ntoday_deaths: ", deaths, "\ntotal_cases: ", cum_cases, "\ntotal_deaths: ", cum_deaths, sep="")) %>%
  filter(date == "2020-04-05") %>%
  distinct(date, cases, deaths, country, .keep_all = TRUE)
})

renderPlotly({
  # Classic ggplot
  p <- ggplot(corona_bubble_df(), aes(x=cases, y=deaths, size = popData2018, color = Continent_Name, text=text)) +
    geom_point(alpha=0.7) +
    scale_x_log10() +
    scale_size(range = c(1.4, 19), name="Population (M)") +
    scale_color_viridis(discrete=TRUE, guide=FALSE) +
    theme_minimal() +
    theme(legend.position="none")

  ggplotly(p, tooltip="text")
})

VI. 더 할 수 있는 것 (과제로 남겨두기)
위 통계는 단순히 확진자수와 사망자수의 통계를 나타나는 것이지만, 인구수 대비 확진자수, 사망자수, 또한 치사율 등을 추가로 구할 수 있을 것이다. 이러한 부분이 매우 중요하다면, shiny의 valueBox 같은 것을 활용하여 보여주는 것도 하나의 좋은 대시보드 자료가 될 수 있다. 이러한 내용들은 향후 코로나 대시보드를 제작할 때 참고 하여 강사가 만든 것 보다 더 좋은 대시보드를 만들어가는데 도움이 되었으면 좋겠다.
VII. Conclusion
오늘은 Bubble Chart를 직접 연습해보고 R Markdown에 응용하는 소스코드를 진행하였다. 시각화 강의 때도 언뜻 설명하였지만, 강사가 다른 그래프보다 plotly를 응용하는 이유는 ggplot2를 지원하기 때문이다. 익숙한 코드로 우선 작업후 ggplotly() 함수 한줄이면 충분히 Interactive하게 시각화를 해줄 수 있다. 지난 포스팅에서는 dygraphs 패키지를 사용하면서 동적 시각화를 작성했고, 오늘은 plotly 패키지를 구성하여 작업했다.
이글을 읽는 사람들에게 작게나마 도움이 되기를 바란다.
Pray for Victims of Covid_19. Contribution to them with this tutorial.
VIII. Reference
Holtz Yan. (2019). Interactive bubble chart. Retrieved April 8, 2020, from https://www.r-graph-gallery.com/bubble_chart_interactive_ggplotly.html
