MLFlow with Scikit-Learn
Page content
개요
- Scikit-Learn 모델을 만든 후, MLFlow로 모델을 배포한다.
- 머신러닝 코드에 대한 설명은 생략한다.
- 가상환경 설정에 관한 내용도 생략한다.
라이브러리 불러오기
- 기존 코드에서 mlflow 라이브러리만 추가한다.
%matplotlib inline

import numpy as np
import pandas as pd
import matplotlib as mpl
import matplotlib.pyplot as plt
import sklearn
import seaborn as sns
import mlflow
import mlflow.sklearn
from sklearn.linear_model import LogisticRegression
from sklearn.model_selection import train_test_split, KFold
from sklearn.preprocessing import StandardScaler
from sklearn.metrics import roc_auc_score, plot_roc_curve, confusion_matrix

print(f"numpy version {np.__version__}")
print(f"pandas version {pd.__version__}")
print(f"matplotlib version {mpl.__version__}")
print(f"seaborn version {sns.__version__}")
print(f"sklearn version {sklearn.__version__}")
print(f"MLFlow version {mlflow.__version__}")
numpy version 1.23.1
pandas version 1.4.3
matplotlib version 3.5.2
seaborn version 0.11.2
sklearn version 1.1.1
MLFlow version 1.27.0
데이터 불러오기
- 데이터를 불러오도록 한다.
DATA_PATH = "C:\\Users\\your_id\\Desktop\\mlops_tutorial\\data\\creditcard.csv"

df = pd.read_csv(DATA_PATH)
print(df.head())
   Time        V1        V2        V3        V4        V5        V6        V7  \
0   0.0 -1.359807 -0.072781  2.536347  1.378155 -0.338321  0.462388  0.239599
1   0.0  1.191857  0.266151  0.166480  0.448154  0.060018 -0.082361 -0.078803
2   1.0 -1.358354 -1.340163  1.773209  0.379780 -0.503198  1.800499  0.791461
3   1.0 -0.966272 -0.185226  1.792993 -0.863291 -0.010309  1.247203  0.237609
4   2.0 -1.158233  0.877737  1.548718  0.403034 -0.407193  0.095921  0.592941

         V8        V9  ...       V21       V22       V23       V24       V25  \
0  0.098698  0.363787  ... -0.018307  0.277838 -0.110474  0.066928  0.128539
1  0.085102 -0.255425  ... -0.225775 -0.638672  0.101288 -0.339846  0.167170
2  0.247676 -1.514654  ...  0.247998  0.771679  0.909412 -0.689281 -0.327642
3  0.377436 -1.387024  ... -0.108300  0.005274 -0.190321 -1.175575  0.647376
4 -0.270533  0.817739  ... -0.009431  0.798278 -0.137458  0.141267 -0.206010

        V26       V27       V28  Amount  Class
0 -0.189115  0.133558 -0.021053  149.62      0
1  0.125895 -0.008983  0.014724    2.69      0
2 -0.139097 -0.055353 -0.059752  378.66      0
3 -0.221929  0.062723  0.061458  123.50      0
4  0.502292  0.219422  0.215153   69.99      0

[5 rows x 31 columns]
로지스틱 모형 만들기
- 기존 코드를 참조하여 모델을 만든다.
- 데이터셋 분리를 한다.
normal = df[df['Class'] == 0].sample(frac=0.5, random_state=42).reset_index(drop=True)
anomaly = df[df['Class']==1]

normal_train, normal_test = train_test_split(normal, test_size = 0.2, random_state=42)
anomary_train, anomary_test = train_test_split(anomaly, test_size = 0.2, random_state=42)

normal_train, normal_validate = train_test_split(normal_train, test_size = 0.25, random_state=42)
anomary_train, anomary_validate = train_test_split(anomary_train, test_size = 0.25, random_state=42)

normal_train.shape, normal_validate.shape, anomary_train.shape, anomary_validate.shape
((85294, 31), (28432, 31), (294, 31), (99, 31))
- 최종 학습, 테스트 및 검증 세트를 생성하기 위해 각각의 정상 및 이상 데이터 분할을 연결해야 한다.
X_train = pd.concat((normal_train, anomary_train))
X_test = pd.concat((normal_test, anomary_test))
X_validate = pd.concat((normal_validate, anomary_validate))

y_train = np.array(X_train["Class"])
y_test = np.array(X_test["Class"])
y_validate = np.array(X_validate["Class"])

X_train = X_train.drop("Class", axis = 1)
X_test = X_test.drop("Class", axis = 1)
X_validate = X_validate.drop("Class", axis = 1)

X_train.shape, X_validate.shape, X_test.shape, y_train.shape, y_validate.shape, y_test.shape
((85588, 30), (28531, 30), (28531, 30), (85588,), (28531,), (28531,))
- 표준화를 진행한다.
scaler = StandardScaler()
scaler.fit(X_train)

X_train = scaler.transform(X_train)
X_test = scaler.transform(X_test)
X_validate = scaler.transform(X_validate)
MLFlow를 통한 학습 및 평가
- MLFlow 기능으로 검증에 사용하는 사용자 정의 함수를 만들어 본다.
- 여기서 핵심은
mlflow.log_metric()함수를 통해 지표를 로깅할 수 있음mlflow.log_artifact()함수를 통해 그래프를 저장할 수 잇음.
def train(sk_model, X_train, y_train):
    sk_model = sk_model.fit(X_train, y_train)
    train_acc = sk_model.score(X_train, y_train)
    mlflow.log_metric("train_acc", train_acc)

    print(f"Train Accuracy: (train_acc:.3%)")


def evaluate(sk_model, X_test, y_test):
    eval_acc = sk_model.score(X_test, y_test)
    preds = sk_model.predict(X_test)
    auc_score = roc_auc_score(y_test, preds)
    mlflow.log_metric("eval_acc", eval_acc)
    mlflow.log_metric("auc_score", auc_score)

    print(f"Auc Score : {auc_score:.3%}")
    print(f"Eval Score : {eval_acc:.3%}")
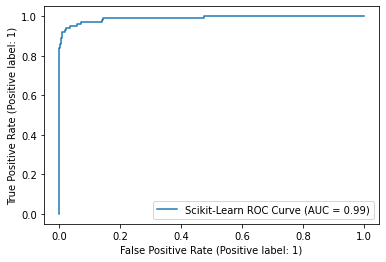
    roc_plot = plot_roc_curve(sk_model, X_test, y_test, name="Scikit-Learn ROC Curve")
    plt.savefig("sklearn_roc_plot.png")
    plt.show()
    plt.clf()
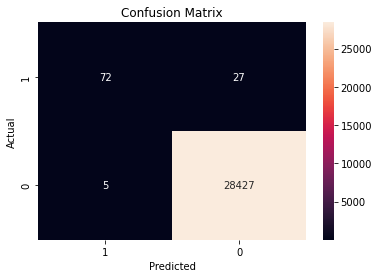
    conf_matrix = confusion_matrix(y_test, preds)
    ax = sns.heatmap(conf_matrix, annot=True, fmt='g')
    ax.invert_xaxis()
    ax.invert_yaxis()
    plt.ylabel("Actual")
    plt.xlabel("Predicted")
    plt.title("Confusion Matrix")
    plt.savefig("sklearn_conf_matrix.png")
    mlflow.log_artifact("sklearn_roc_plot.png")
    mlflow.log_artifact("sklearn_conf_matrix.png")
MLFlow 실행 로깅 및 확인
- 실제 실험 이름을 설정하고, MLFlow 실행 시작. 해당 코드를 모두 실행한다.
# 모델 설정
sk_model = LogisticRegression(random_state=None, max_iter=400, solver='newton-cg')

# 실험 이름 설정
mlflow.set_experiment("sklearn_experiment")

# 해당 이름으로 실행 배치
with mlflow.start_run():
    train(sk_model, X_train, y_train)
    evaluate(sk_model, X_test, y_test)

    # 하나의 MLFlow 실행 컨텍스트에서 모든 코드를 묶을 수 있음.
    # 참조 : https://mlflow.org/docs/latest/models.html#model-customization
    mlflow.sklearn.log_model(sk_model, 'log_reg_model')

    # 본질적으로 모델과 지표가 로깅되는 현재 실행을 가져오고 출력함.
    print("Model run: ", mlflow.active_run().info.run_uuid)
mlflow.end_run()
Train Accuracy: (train_acc:.3%)
Auc Score : 86.355%
Eval Score : 99.888%


C:\Users\your_id\Desktop\mlops_tutorial\venv\lib\site-packages\sklearn\utils\deprecation.py:87: FutureWarning: Function plot_roc_curve is deprecated; Function :func:`plot_roc_curve` is deprecated in 1.0 and will be removed in 1.2. Use one of the class methods: :meth:`sklearn.metric.RocCurveDisplay.from_predictions` or :meth:`sklearn.metric.RocCurveDisplay.from_estimator`.
  warnings.warn(msg, category=FutureWarning)
Model run:  8f77ac4ca08047f28eb9d3f6980d5f91


C:\Users\your_id\Desktop\mlops_tutorial\venv\lib\site-packages\_distutils_hack\__init__.py:33: UserWarning: Setuptools is replacing distutils.
  warnings.warn("Setuptools is replacing distutils.")
MLFlow 호출
mlruns가 포함된 디렉터리에서 MLFLow UI를 호출한다.- bash 터미널에서 확인한다.
mlflow ui -p 1234
MLFlow UI 화면
- mlruns가 포함된 동일한 디렉터리에서 아래와 같이 실행한다.
- 해당 코드는 Jupyter Notebook에서 실행했다.
%%bash
mlflow ui -p 1234
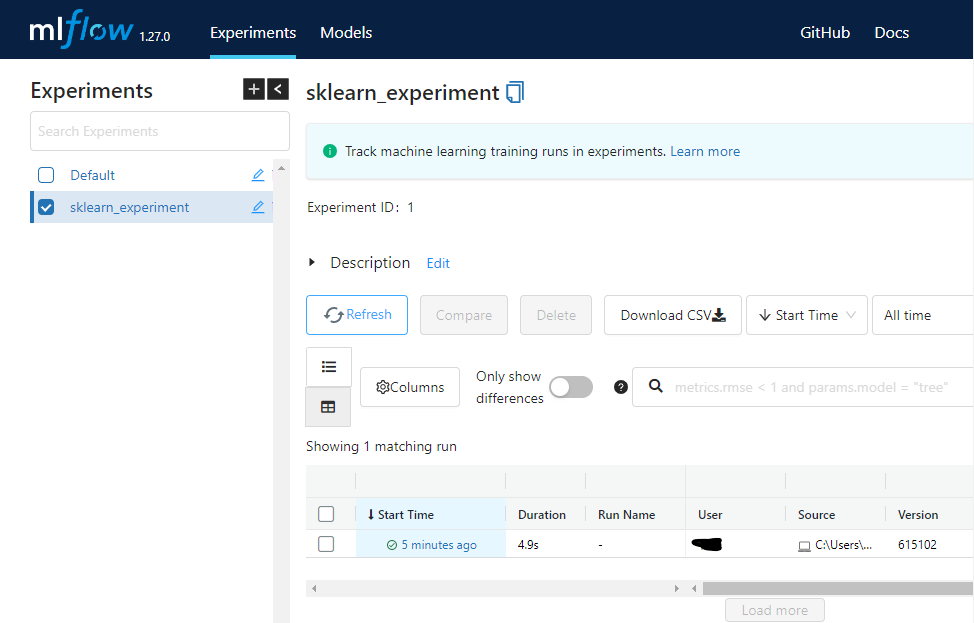
- 현재 화면에서
Models-sklearn를 클릭하면 모둔 파라미터와 지표를 볼 수 있다.
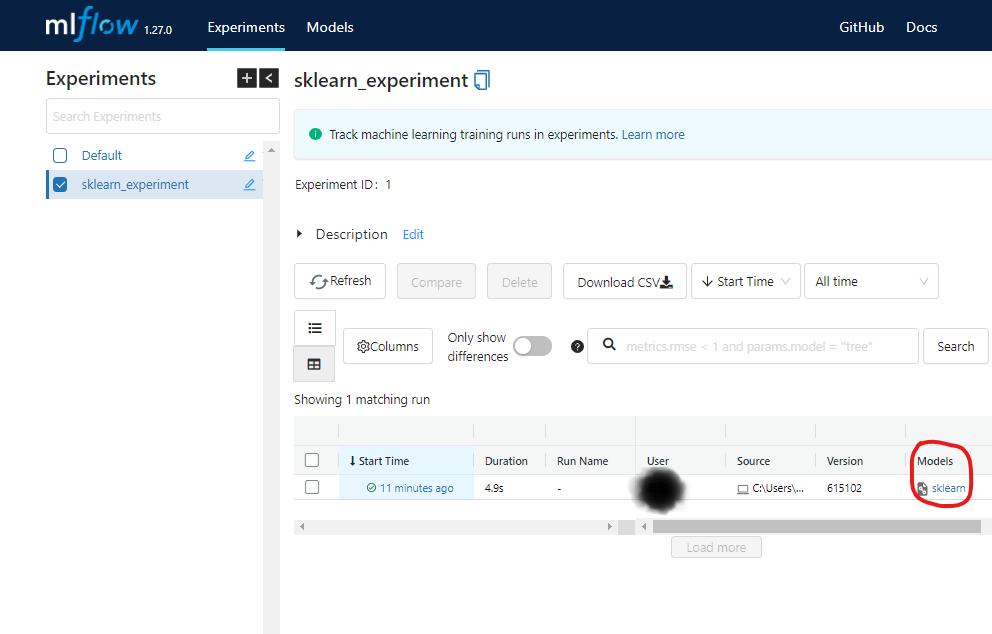
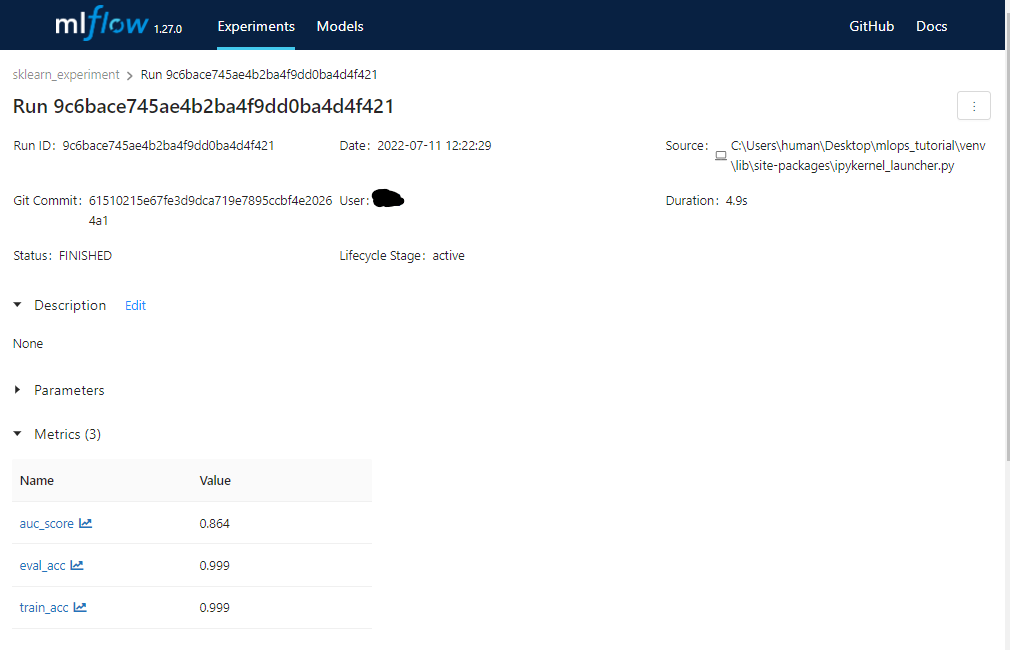
- 아래로 계속 스크롤하면 모든
Artifacts가 표시가 된다. - 또한 그래프 이미지도 같이 올라가는 것을 확인할 수 있다.
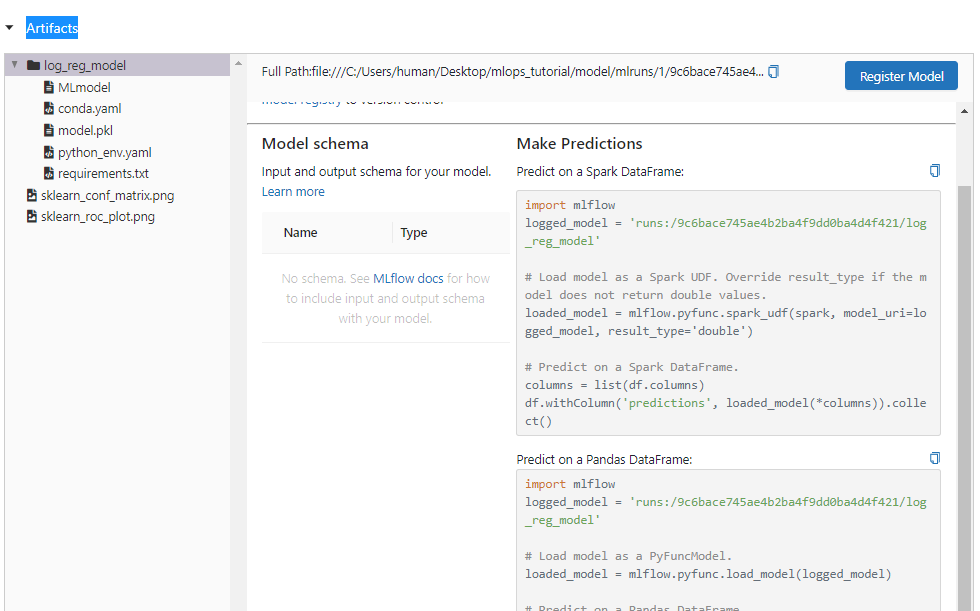
- Deep Learning 파라미터 등도 기록할 수 있다.
- 기 작성된 코드를 재 실행한다.
# 모델 설정
sk_model = LogisticRegression(random_state=None, max_iter=400, solver='newton-cg')

# 실험 이름 설정
mlflow.set_experiment("sklearn_experiment")

# 해당 이름으로 실행 배치
with mlflow.start_run():
    train(sk_model, X_train, y_train)
    evaluate(sk_model, X_test, y_test)

    # 하나의 MLFlow 실행 컨텍스트에서 모든 코드를 묶을 수 있음.
    # 참조 : https://mlflow.org/docs/latest/models.html#model-customization
    mlflow.sklearn.log_model(sk_model, 'log_reg_model')

    # 본질적으로 모델과 지표가 로깅되는 현재 실행을 가져오고 출력함.
    print("Model run: ", mlflow.active_run().info.run_uuid)
mlflow.end_run()
- 여러번 선택하면 다음과 같은 URL이 나오고, 비교 모델을 클릭하면 선택할 수 있다.
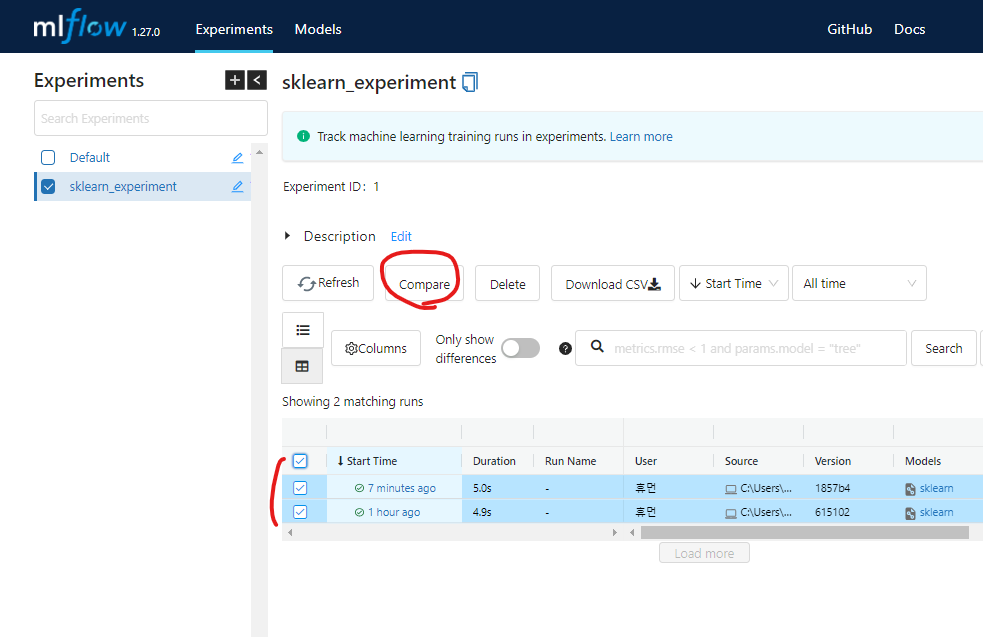
로깅된 모델 적재
- 실행 ID(Run ID)를 복사하고 아래와 같이 실행한다.
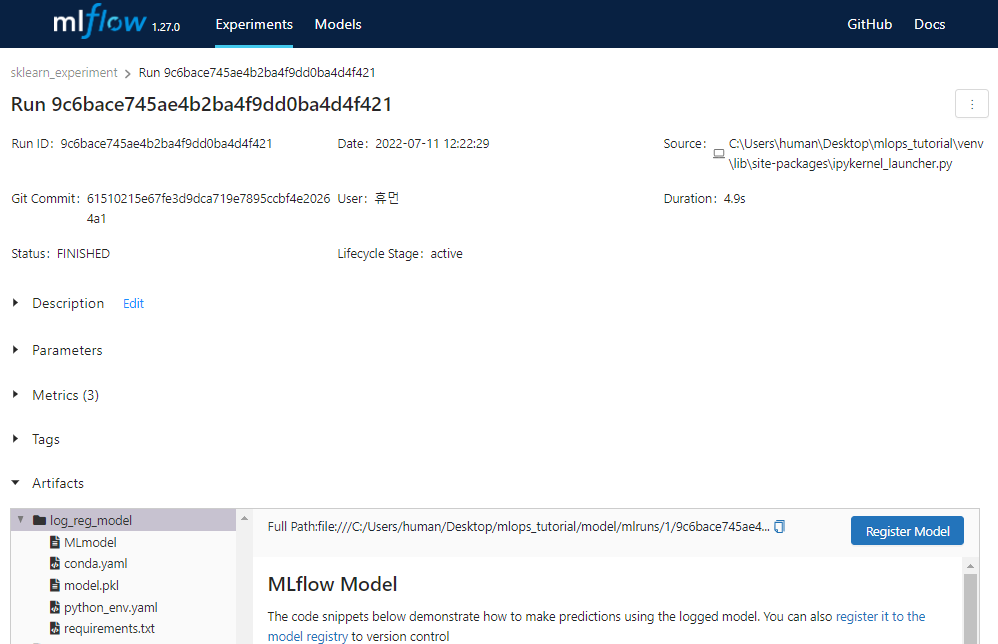
ml_run_id = 'runs:/9c6bace745ae4b2ba4f9dd0ba4d4f421/log_reg_model'
loaded_model = mlflow.sklearn.load_model(ml_run_id)
loaded_model.score(X_test, y_test)
0.9988784129543303
Reference
- Alla, S. and Adari, S., (2020). Beginning MLOps with MLFlow: Deploy Models in AWS SageMaker, Google Cloud, and Microsoft Azure.
