Python 통계 - 포지셔닝 분석(2)
Page content
강의 홍보
- 취준생을 위한 강의를 제작하였습니다.
- 본 블로그를 통해서 강의를 수강하신 분은 게시글 제목과 링크를 수강하여 인프런 메시지를 통해 보내주시기를 바랍니다.
스타벅스 아이스 아메리카노를 선물로 보내드리겠습니다.
- [비전공자 대환영] 제로베이스도 쉽게 입문하는 파이썬 데이터 분석 - 캐글입문기
포지셔닝 분석 개요

- 마케팅에서 자주 보는 분석 방법중의 하나는
포지셔닝(Positioning)기법이다. - 포지셔닝 분석은 마케팅 통계분석 기법중의 하나로, 기업이나, 상품, 브랜드 같은 개체들의 포지셔닝을 수행하는 다차원 척도법(MDS: Multi-Dimensional Scaling)과 상응분석(Correspondence Analysis)이 있다.
- 위 두가지 분석 방법 중 무엇을 사용해야 할까?
- 만약 데이터셋이 주로 등간척도, 비율척도와 같이 구성되어 있다면
다차원 척도법 - 만약 데이터셋이 주로 명목척도, 서열척도와 같이 구성되어 있다면
상응분석
- 만약 데이터셋이 주로 등간척도, 비율척도와 같이 구성되어 있다면
- 현재 삼성카드 대회의 주 데이터셋은 명목척도 및 서열척도로 구성되어 있기 때문에
상응분석으로 시작하면 된다.
상응분석
Correspondence Analysis는 범주형 변수(수준)들 간의 연관성을 분석한 후, 그 결과를 시각적 해석이 용이하도록 그래프화 하는 것임
(1) 기본 개념
- 상응분석을 사용하려면 빈도교차표를 만들어야 한다.
- 요약하면, 상응분석은 범주형 변수의 빈도를 나타내고 있는 빈도교차표의 행과 열(명목변수의 범주 값들)을 그래프상의 자극점 형태로 표시하는 방법.
- 이 때, 단순 상응분석은 2개의 변수, 다중 상응분석은 3개 이상의 변수 활용한다.
- 이 때, 상응분석은 카이제곱 검정과 같이 범주형 변수간의 상호연관성을 바탕으로 진행된다.
- 따라서, 두 개의 범주형 변수가 서로 연관성을 가지고 있다는 전제하에서 진행된다.
(2) 데이터 불러오기
- 먼저 필요한 데이터를 불러온다.
- 필자는 구글 코랩에서 데이터를 불러오기 때문에
%config InlineBackend.figure_format = 'retina'
!apt -qq -y install fonts-nanum
fonts-nanum is already the newest version (20170925-1).
The following package was automatically installed and is no longer required:
  libnvidia-common-440
Use 'apt autoremove' to remove it.
0 upgraded, 0 newly installed, 0 to remove and 39 not upgraded.
import seaborn as sns
import pandas as pd
import matplotlib.pyplot as plt
import matplotlib as mpl
import matplotlib.font_manager as fm
/usr/local/lib/python3.6/dist-packages/statsmodels/tools/_testing.py:19: FutureWarning: pandas.util.testing is deprecated. Use the functions in the public API at pandas.testing instead.
  import pandas.util.testing as tm
for font in fm.fontManager.ttflist:
    if 'Nanum' in font.name:
        print(font.name, font.fname)
NanumMyeongjo /usr/share/fonts/truetype/nanum/NanumMyeongjo.ttf
NanumSquare /usr/share/fonts/truetype/nanum/NanumSquareR.ttf
NanumSquare /usr/share/fonts/truetype/nanum/NanumSquareB.ttf
NanumBarunGothic /usr/share/fonts/truetype/nanum/NanumBarunGothicBold.ttf
NanumMyeongjo /usr/share/fonts/truetype/nanum/NanumMyeongjoBold.ttf
NanumSquareRound /usr/share/fonts/truetype/nanum/NanumSquareRoundR.ttf
NanumSquareRound /usr/share/fonts/truetype/nanum/NanumSquareRoundB.ttf
NanumBarunGothic /usr/share/fonts/truetype/nanum/NanumBarunGothic.ttf
NanumGothic /usr/share/fonts/truetype/nanum/NanumGothic.ttf
NanumGothic /usr/share/fonts/truetype/nanum/NanumGothicBold.ttf
fontpath = '/usr/share/fonts/truetype/nanum/NanumGothic.ttf'
font = fm.FontProperties(fname=fontpath, size=9)
plt.rc('font', family='NanumGothic')
plt.rcParams["figure.figsize"] = (20, 10)
plt.rcParams['lines.linewidth'] = 2
plt.rcParams['lines.color'] = 'r'
plt.rcParams['axes.grid'] = True
mpl.font_manager._rebuild()
fm._rebuild()
font = {'family' : 'NanumGothic',
        'weight' : 'bold',
        'size'   : 22}

plt.rc('font', **font)
plt.text(0.3, 0.3, '한글', size=100)
Text(0.3, 0.3, '한글')
# Mount Google Drive
from google.colab import drive # import drive from google colab

ROOT = "/content/drive"     # default location for the drive
print(ROOT)                 # print content of ROOT (Optional)
drive.mount(ROOT)           # we mount the google drive at /content/drive
/content/drive
Drive already mounted at /content/drive; to attempt to forcibly remount, call drive.mount("/content/drive", force_remount=True).
# import join used to join ROOT path and MY_GOOGLE_DRIVE_PATH
from os.path import join

# path to your project on Google Drive
MY_GOOGLE_DRIVE_PATH = 'My Drive/Colab Notebooks/inflearn/Python/Kaggle_Edu/05_statistics/'

PROJECT_PATH = join(ROOT, MY_GOOGLE_DRIVE_PATH)
print(PROJECT_PATH)
/content/drive/My Drive/Colab Notebooks/inflearn/Python/Kaggle_Edu/05_statistics/
%cd "{PROJECT_PATH}"
/content/drive/My Drive/Colab Notebooks/inflearn/Python/Kaggle_Edu/05_statistics
%ls
Chapter_5_1_positioning_analysis_1.ipynb [0m[01;34mpython_stat[0m/
Chapter_5_2_positioning_analysis_2.ipynb
import pandas as pd
data = pd.read_csv("python_stat/Correspondence.csv", sep=",", encoding="CP949")
data.head()
| id | resort | slope | traffic | lodging | etc | |
|---|---|---|---|---|---|---|
| 0 | 1 | 대명 | Slope-H | Traffic-H | Lodging-H | Etc-H |
| 1 | 2 | 대명 | Slope-H | Traffic-M | Lodging-H | Etc-L |
| 2 | 3 | 대명 | Slope-L | Traffic-M | Lodging-M | Etc-M |
| 3 | 4 | 대명 | Slope-L | Traffic-H | Lodging-M | Etc-M |
| 4 | 5 | 대명 | Slope-M | Traffic-M | Lodging-L | Etc-M |
- 변수명 정리
- ID: 고객 고유 번호 (명목척도)
- Resort: 평가 리조트 이름 (명목척도)
- slope: 슬로프 난이도(명목척도)
- traffic: 교통 편의성(명목척도)
- lodging: 숙박 편의성(명목척도)
- etc: 기타시설 편의성(명목척도)
- 난이도 및 편의성은 모두
상중하로 구성되어 있다.
(3) 상응분석의 개념적 분석 과정
- 본 포스트에서는 내용에 대해서는 디테일하게 다루지 않는다.
- 자세한 것은
Reference교재를 확인한다. - 첫째, 빈도교차표 형태의 데이터를 준비한다.
- 둘째, 기대 빈도교차표를 작성한다.
- 셋째, 카이제곱 행렬표를 작성한다.
- 넷째, 차원 좌표 생성한다.
- 다섯째, 마지막으로 좌표계 맵핑을 진행한다.
(4) 패키지 설치
price패키지를 설치한다.
!pip install prince
Requirement already satisfied: prince in /usr/local/lib/python3.6/dist-packages (0.7.0)
Requirement already satisfied: matplotlib>=3.0.2 in /usr/local/lib/python3.6/dist-packages (from prince) (3.2.2)
Requirement already satisfied: scipy>=1.3.0 in /usr/local/lib/python3.6/dist-packages (from prince) (1.4.1)
Requirement already satisfied: pandas>=1.0.3 in /usr/local/lib/python3.6/dist-packages (from prince) (1.0.5)
Requirement already satisfied: scikit-learn>=0.22.1 in /usr/local/lib/python3.6/dist-packages (from prince) (0.22.2.post1)
Requirement already satisfied: numpy>=1.17.1 in /usr/local/lib/python3.6/dist-packages (from prince) (1.18.5)
Requirement already satisfied: python-dateutil>=2.1 in /usr/local/lib/python3.6/dist-packages (from matplotlib>=3.0.2->prince) (2.8.1)
Requirement already satisfied: pyparsing!=2.0.4,!=2.1.2,!=2.1.6,>=2.0.1 in /usr/local/lib/python3.6/dist-packages (from matplotlib>=3.0.2->prince) (2.4.7)
Requirement already satisfied: cycler>=0.10 in /usr/local/lib/python3.6/dist-packages (from matplotlib>=3.0.2->prince) (0.10.0)
Requirement already satisfied: kiwisolver>=1.0.1 in /usr/local/lib/python3.6/dist-packages (from matplotlib>=3.0.2->prince) (1.2.0)
Requirement already satisfied: pytz>=2017.2 in /usr/local/lib/python3.6/dist-packages (from pandas>=1.0.3->prince) (2018.9)
Requirement already satisfied: joblib>=0.11 in /usr/local/lib/python3.6/dist-packages (from scikit-learn>=0.22.1->prince) (0.16.0)
Requirement already satisfied: six>=1.5 in /usr/local/lib/python3.6/dist-packages (from python-dateutil>=2.1->matplotlib>=3.0.2->prince) (1.15.0)
- 포지셔닝 분석 중 단순 상응분석에 대한 내용은 기존 포스트를 참고하기를 바란다.
다중 상응분석
- MCA(Multiple Correspondence Analysis)는 3개 이상 변수들의 복합적인 교차빈도분할표를 이용해서 분석하는 분석 방법을 말한다.
- 다중 상응분석을 하기 위해서는
MCA()함수를 사용한다. - 본격적으로 다중 상응분석을 실시해본다.
import prince
input_X = data[['resort', 'traffic', 'lodging','slope','etc']]
mca = prince.MCA(n_components=2).fit(input_X)
(1) 차원좌표
column_coordinates()속성을 활용하여 resort, slope, traffic, lodging, etc 등의 차원 좌표를 불러올 수 있다.- 해당 분야를 출력해본다.
mca.column_coordinates(input_X)
| 0 | 1 | |
|---|---|---|
| resort_대명 | -0.478198 | -0.732122 |
| resort_리솜 | 1.340944 | -0.427030 |
| resort_무주 | 0.192214 | 1.728775 |
| resort_용평 | -0.978080 | -0.366669 |
| resort_한화 | -0.076880 | -0.202954 |
| traffic_Traffic-H | -0.597015 | -0.824843 |
| traffic_Traffic-L | 0.914458 | 0.511569 |
| traffic_Traffic-M | -0.297904 | 0.058322 |
| lodging_Lodging-H | 0.614713 | -0.865625 |
| lodging_Lodging-L | -0.615669 | 0.668687 |
| lodging_Lodging-M | -0.067505 | 0.260296 |
| slope_Slope-H | 0.404687 | -0.382117 |
| slope_Slope-L | 0.086027 | 0.427853 |
| slope_Slope-M | -0.561878 | -0.080357 |
| etc_Etc-H | 1.070717 | -0.049837 |
| etc_Etc-L | -0.553935 | -0.265351 |
| etc_Etc-M | -0.318144 | 0.222761 |
(2) 시각화
- 이제 위 차원을 시각화로 구현해본다.
import matplotlib.pyplot as plt

# 폰트 세팅
font = {'family' : 'NanumGothic',
        'weight' : 'bold',
        'size'   : 14}

plt.rc('font', **font)

# 시각화
ax = mca.plot_coordinates(X = input_X, figsize=(10, 10), show_column_labels=True)
ax.set_title("상응분석", fontsize = 24)
Text(0.5, 1.0, '상응분석')


/usr/local/lib/python3.6/dist-packages/matplotlib/backends/backend_agg.py:214: RuntimeWarning: Glyph 8722 missing from current font.
  font.set_text(s, 0.0, flags=flags)
/usr/local/lib/python3.6/dist-packages/matplotlib/backends/backend_agg.py:183: RuntimeWarning: Glyph 8722 missing from current font.
  font.set_text(s, 0, flags=flags)
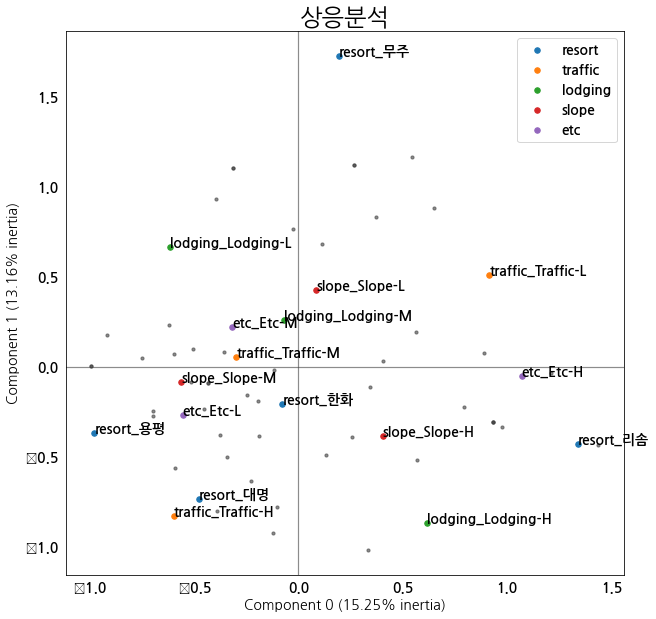
- 여기에서 하나 주의해야 하는 것이 있다.
- 좌표계에 표시된
Component 0 (17.62%)와Component 1 (15.56%)비율의 합이100이 되지 않는다는 점이다. - 이는 분석에서 사용된 변수가 5개 이지만, 2개의 차원으로 축약하면서 정보의 손실이 발생했다는 뜻이다.
- 좌표계에 표시된
- 우선 위 그래프를 해석하는 방법 단순상응분석과 동일하다.
- 포괄적으로 보면, 대명, 용평, 한화가 서로 경쟁관계에 있다.
- 리솜과 무주는 다른 그룹과 조금 떨어져 있다.
- 숙박과 기타 편의성은 리솜이 경쟁력이 있고, 교통 편의성은 대명이 우수하다.
- 다양한 변수등을 조합하여 한꺼번에 위치를 확인할 수 있다는 점에서 위 분석 방법은 매우 직관적인 결과를 제공한다.
결론
- 범주형 데이터를 다루는 것은 쉽지 않다.
- 그러나, 실제 마케팅에서는 이러한 범주형 데이터가 많은 것 또한 사실이다.
- 단순하게, 막대 그래프를 그리는 것보다, 각 데이터의 차이를 앎으로써, 보다 직관적으로 해석해줄 수 있는 이러한 분석은 활용하기에 매우 좋다.
- 이제 삼성카드 데이터에 적용을 해본다.
Reference
- 김형수(2020). Step by Step 파이썬 비즈니스 통계분석. 서울: 프레딕스.