머신러닝 알고리즘 - 분류 Tutorial
Page content
개요
- Kaggle 대회인 `Titanic’대회를 통해 분류 모형을 만들어본다.
- 본 강의는 수업 자료의 일부로 작성되었다.
I. 사전 준비작업
Kaggle API설치 및 연동해서GCP에 데이터를 적재하는 것까지 진행한다.
(1) Kaggle API 설치
- 구글 코랩에서
API를 불러오려면 다음 소스코드를 실행한다.
!pip install kaggle
Requirement already satisfied: kaggle in /usr/local/lib/python3.6/dist-packages (1.5.6)
Requirement already satisfied: requests in /usr/local/lib/python3.6/dist-packages (from kaggle) (2.23.0)
Requirement already satisfied: urllib3<1.25,>=1.21.1 in /usr/local/lib/python3.6/dist-packages (from kaggle) (1.24.3)
Requirement already satisfied: python-slugify in /usr/local/lib/python3.6/dist-packages (from kaggle) (4.0.1)
Requirement already satisfied: tqdm in /usr/local/lib/python3.6/dist-packages (from kaggle) (4.41.1)
Requirement already satisfied: certifi in /usr/local/lib/python3.6/dist-packages (from kaggle) (2020.6.20)
Requirement already satisfied: python-dateutil in /usr/local/lib/python3.6/dist-packages (from kaggle) (2.8.1)
Requirement already satisfied: six>=1.10 in /usr/local/lib/python3.6/dist-packages (from kaggle) (1.15.0)
Requirement already satisfied: chardet<4,>=3.0.2 in /usr/local/lib/python3.6/dist-packages (from requests->kaggle) (3.0.4)
Requirement already satisfied: idna<3,>=2.5 in /usr/local/lib/python3.6/dist-packages (from requests->kaggle) (2.10)
Requirement already satisfied: text-unidecode>=1.3 in /usr/local/lib/python3.6/dist-packages (from python-slugify->kaggle) (1.3)
(2) Kaggle Token 다운로드
- Kaggle에서 API Token을 다운로드 받는다.
- [Kaggle]-[My Account]-[API]-[Create New API Token]을 누르면
kaggle.json파일이 다운로드 된다. - 이 파일을 바탕화면에 옮긴 뒤, 아래 코드를 실행 시킨다.
from google.colab import files
uploaded = files.upload()
for fn in uploaded.keys():
  print('uploaded file "{name}" with length {length} bytes'.format(
      name=fn, length=len(uploaded[fn])))

# kaggle.json을 아래 폴더로 옮긴 뒤, file을 사용할 수 있도록 권한을 부여한다.
!mkdir -p ~/.kaggle/ && mv kaggle.json ~/.kaggle/ && chmod 600 ~/.kaggle/kaggle.json
Upload widget is only available when the cell has been executed in the current browser session. Please rerun this cell to enable.
Saving kaggle.json to kaggle.json
uploaded file "kaggle.json" with length 64 bytes
- 실제
kaggle.json파일이 업로드 되었다는 뜻이다.
ls -1ha ~/.kaggle/kaggle.json
/root/.kaggle/kaggle.json
(3) Kaggle 데이터 불러오기
Kaggle대회 리스트를 불러온다.
!kaggle competitions list
Warning: Looks like you're using an outdated API Version, please consider updating (server 1.5.6 / client 1.5.4)
ref                                            deadline             category            reward  teamCount  userHasEntered
---------------------------------------------  -------------------  ---------------  ---------  ---------  --------------
tpu-getting-started                            2030-06-03 23:59:00  Getting Started      Kudos        220           False
digit-recognizer                               2030-01-01 00:00:00  Getting Started  Knowledge       2946           False
titanic                                        2030-01-01 00:00:00  Getting Started  Knowledge      22053            True
house-prices-advanced-regression-techniques    2030-01-01 00:00:00  Getting Started  Knowledge       5060            True
connectx                                       2030-01-01 00:00:00  Getting Started  Knowledge        816           False
nlp-getting-started                            2030-01-01 00:00:00  Getting Started      Kudos       1565            True
competitive-data-science-predict-future-sales  2020-12-31 23:59:00  Playground           Kudos       7918           False
osic-pulmonary-fibrosis-progression            2020-10-06 23:59:00  Featured           $55,000        386           False
halite                                         2020-09-15 23:59:00  Featured              Swag        791           False
birdsong-recognition                           2020-09-15 23:59:00  Research           $25,000        462           False
landmark-retrieval-2020                        2020-08-17 23:59:00  Research           $25,000        239           False
siim-isic-melanoma-classification              2020-08-17 23:59:00  Featured           $30,000       2464           False
global-wheat-detection                         2020-08-04 23:59:00  Research           $15,000       1932           False
open-images-object-detection-rvc-2020          2020-07-31 16:00:00  Playground       Knowledge         66           False
open-images-instance-segmentation-rvc-2020     2020-07-31 16:00:00  Playground       Knowledge         12           False
hashcode-photo-slideshow                       2020-07-27 23:59:00  Playground       Knowledge         73           False
prostate-cancer-grade-assessment               2020-07-22 23:59:00  Featured           $25,000       1028           False
alaska2-image-steganalysis                     2020-07-20 23:59:00  Research           $25,000       1115           False
m5-forecasting-accuracy                        2020-06-30 23:59:00  Featured           $50,000       5558            True
m5-forecasting-uncertainty                     2020-06-30 23:59:00  Featured           $50,000        909           False
- 여기에서 참여하기 원하는 대회의 데이터셋을 불러오면 된다.
- 이번
basic강의에서는kkbox-churn-prediction-challenge데이터를 활용한 데이터 가공과 시각화를 연습할 것이기 때문에 아래와 같이 코드를 실행하여 데이터를 불러온다.
!kaggle competitions download -c titanic
Warning: Looks like you're using an outdated API Version, please consider updating (server 1.5.6 / client 1.5.4)
Downloading train.csv to /content
  0% 0.00/59.8k [00:00<?, ?B/s]
100% 59.8k/59.8k [00:00<00:00, 58.6MB/s]
Downloading gender_submission.csv to /content
  0% 0.00/3.18k [00:00<?, ?B/s]
100% 3.18k/3.18k [00:00<00:00, 3.44MB/s]
Downloading test.csv to /content
  0% 0.00/28.0k [00:00<?, ?B/s]
100% 28.0k/28.0k [00:00<00:00, 28.3MB/s]
- 실제 데이터가 잘 다운로드 받게 되었는지 확인한다.
!ls
gender_submission.csv	       test.csv		    transactions_v2.csv.7z
members_v3.csv.7z	       train.csv	    user_logs.csv.7z
sample_data		       train.csv.7z	    user_logs_v2.csv.7z
sample_submission_v2.csv.7z    train_v2.csv.7z	    WSDMChurnLabeller.scala
sample_submission_zero.csv.7z  transactions.csv.7z
(4) BigQuery에 데이터 적재
sample_submission.csv,test.csv,train.csv데이터를 불러와서 빅쿼리에 적재를 한다.- 로컬에서 빅쿼리로 데이터를 Load하는 방법에는 여러가지가 있다.
Local에서 직접 올리기 (단, 10MB 이하)Google Stroage활용Pandas활용
Google Stroage를 활용하려면 클라우드 수업으로 진행되기 때문에,Pandas패키지를 활용한다.to_gbq라는 함수를 사용하는데, 이를 위해서는 보통pandas-gbq package패키지를 별도로 설치를 해야한다.- 다행히도, 구글
Colab에서는 위 패키지는 별도로 설치할 필요가 없다.
import pandas as pd
from pandas.io import gbq

# import sample_submission file
gender_submission = pd.read_csv('gender_submission.csv')

# Connect to Google Cloud API and Upload DataFrame
gender_submission.to_gbq(destination_table='titanic_classification.gender_submission',
                  project_id='bigquerytutorial-274406',
                  if_exists='replace')
Please visit this URL to authorize this application: https://accounts.google.com/o/oauth2/auth?response_type=code&client_id=725825577420-unm2gnkiprugilg743tkbig250f4sfsj.apps.googleusercontent.com&redirect_uri=urn%3Aietf%3Awg%3Aoauth%3A2.0%3Aoob&scope=https%3A%2F%2Fwww.googleapis.com%2Fauth%2Fbigquery&state=6WuVr7UTuUT2xAe1gjci8tyGZ5t46s&prompt=consent&access_type=offline
Enter the authorization code: 4/2QFcBrm2ui5JMeBU3L43UfLheY4LOZG2ZlWZtcZ4_K_kJieLYvmJSk0


1it [00:04,  4.43s/it]
import pandas as pd
from pandas.io import gbq
# import train file
train = pd.read_csv('train.csv')
column명을 확인해본다.
print(train.columns)
Index(['PassengerId', 'Survived', 'Pclass', 'Name', 'Sex', 'Age', 'SibSp',
       'Parch', 'Ticket', 'Fare', 'Cabin', 'Embarked'],
      dtype='object')
train.to_gbq(destination_table='titanic_classification.train',
                  project_id='bigquerytutorial-274406',
                  if_exists='replace')
1it [00:02, 2.89s/it]
# Connect to Google Cloud API and Upload DataFrame
test = pd.read_csv('test.csv')
test.to_gbq(destination_table='titanic_classification.test',
            project_id='bigquerytutorial-274406',
            if_exists='replace')
1it [00:04, 4.63s/it]
- 실제 데이터가 들어갔는지 빅쿼리에서 확인한다.
II. 데이터 피처공학
- 사이킷런 패키지는 기본적으로 결측치를 허용하지 않기 때문에, 반드시 확인 후, 처리해야 한다.
- 이번에는
BigQuery를 통해 데이터를 불러온다. - 주요 데이터 추출을 위한 피처공학에 대해 배워본다.
(1) 주요 패키지 불러오기
- 이제 주요 패키지를 불러온다.
import numpy as np
import pandas as pd

from sklearn import preprocessing
import matplotlib.pyplot as plt
plt.rc("font", size=14)
import seaborn as sns
sns.set(style="white") #white background style for seaborn plots
sns.set(style="whitegrid", color_codes=True)

import warnings
warnings.simplefilter(action='ignore')
(2) 데이터 불러오기
from google.colab import auth
auth.authenticate_user()
print('Authenticated')
Authenticated
# 구글 인증 라이브러리
from google.colab import auth

# 빅쿼리 관련 라이브러리
from google.cloud import bigquery
from tabulate import tabulate
import pandas as pd
- 먼저 훈련 데이터를 불러온다.
from google.cloud import bigquery
from tabulate import tabulate
import pandas as pd

project_id = 'bigquerytutorial-274406'
client = bigquery.Client(project=project_id)

df_train = client.query('''
  SELECT
      *
  FROM `bigquerytutorial-274406.titanic_classification.train`
  ''').to_dataframe()

df_train.shape
(891, 12)
- 그 다음은 테스트 데이터를 불러온다.
df_test = client.query('''
  SELECT
      *
  FROM `bigquerytutorial-274406.titanic_classification.test`
  ''').to_dataframe()

df_test.shape
(418, 11)
- 아래 코드는 출력 시, 전체
Column에 대해 확인할 수 있음
pd.options.display.max_columns = None
# df_train.head()
- 각 데이터에 대한 설명은 다음을 참조한다.
(3) 결측 데이터 확인
# data set의 Percent 구하는 함수를 짜보자.
def check_fill_na(data):
  new_df = data.copy()
  new_df_na = (new_df.isnull().sum() / len(new_df)) * 100
  new_df_na.sort_values(ascending=False).reset_index(drop=True)
  new_df_na = new_df_na.drop(new_df_na[new_df_na == 0].index).sort_values(ascending=False)
  return new_df_na

check_fill_na(df_train)
Cabin       77.104377
Age         19.865320
Embarked     0.224467
dtype: float64
- 각 데이터에 대한 구체적인 그래프를 작성해본다.
ax = train["Age"].hist(bins=15, density=True, stacked=True, color='teal', alpha=0.6)
train["Age"].plot(kind='density', color='teal')
ax.set(xlabel='Age')
plt.xlim(-10,85)
plt.show()

print(train['Embarked'].value_counts())
sns.countplot(x='Embarked', data=train, palette='Set2')
plt.show()
S    644
C    168
Q     77
Name: Embarked, dtype: int64

- 결측치에 대한 보간을 진행한다.
Age는 중간값Embarked는S로 채웠다.Cabin은 삭제하기로 했다.
train_data = train.copy()
train_data["Age"].fillna(train["Age"].median(skipna=True), inplace=True)
train_data["Embarked"].fillna(train['Embarked'].value_counts().idxmax(), inplace=True)
train_data.drop('Cabin', axis=1, inplace=True)
check_fill_na(train_data)
Series([], dtype: float64)
- 위 데이터에 결측치가 없도록 처리하였다.
(4) 도출변수
SilSp+Parch변수를 조합하여 혼자 여행을 온 것인지 아닌지 구분하는 도출 변수를 만든 후, 위 변수는 삭제 한다.
## Create categorical variable for traveling alone
train_data['TravelAlone']=np.where((train_data["SibSp"]+train_data["Parch"])>0, 0, 1)
train_data.drop('SibSp', axis=1, inplace=True)
train_data.drop('Parch', axis=1, inplace=True)
Age별 생존여부에 관한 그래프를 작성한다.
plt.figure(figsize=(20,8))
avg_survival_byage = final_train[["Age", "Survived"]].groupby(['Age'], as_index=False).mean()
g = sns.barplot(x='Age', y='Survived', data=avg_survival_byage, color="LightSeaGreen")
plt.show()

- 그 후에
under_age에 대한 도출변수를 추가로 만든다.
train_data['IsMinor']=np.where(train_data['Age']<=16, 1, 0)
(5) 원-핫 인코딩
- 각
Column특히,문자형 변수에 대해 원-핫 인코딩을 진행한다.
#create categorical variables and drop some variables
training=pd.get_dummies(train_data, columns=["Pclass","Embarked","Sex"])
training.drop('Sex_female', axis=1, inplace=True)
training.drop('PassengerId', axis=1, inplace=True)
training.drop('Name', axis=1, inplace=True)
training.drop('Ticket', axis=1, inplace=True)

final_train = training
final_train.info()
<class 'pandas.core.frame.DataFrame'>
RangeIndex: 891 entries, 0 to 890
Data columns (total 12 columns):
 #   Column       Non-Null Count  Dtype
---  ------       --------------  -----
 0   Survived     891 non-null    int64
 1   Age          891 non-null    float64
 2   Fare         891 non-null    float64
 3   TravelAlone  891 non-null    int64
 4   IsMinor      891 non-null    int64
 5   Pclass_1     891 non-null    uint8
 6   Pclass_2     891 non-null    uint8
 7   Pclass_3     891 non-null    uint8
 8   Embarked_C   891 non-null    uint8
 9   Embarked_Q   891 non-null    uint8
 10  Embarked_S   891 non-null    uint8
 11  Sex_male     891 non-null    uint8
dtypes: float64(2), int64(3), uint8(7)
memory usage: 41.0 KB
- 위에 했던 작업을 동일하게
test데이터에도 적용한다.
test_data = test.copy()
test_data["Age"].fillna(test["Age"].median(skipna=True), inplace=True)
test_data["Fare"].fillna(test["Fare"].median(skipna=True), inplace=True)
test_data.drop('Cabin', axis=1, inplace=True)

test_data['TravelAlone']=np.where((test_data["SibSp"]+test_data["Parch"])>0, 0, 1)

test_data.drop('SibSp', axis=1, inplace=True)
test_data.drop('Parch', axis=1, inplace=True)

test_data['IsMinor']=np.where(test_data['Age']<=16, 1, 0)

testing = pd.get_dummies(test_data, columns=["Pclass","Embarked","Sex"])
testing.drop('Sex_female', axis=1, inplace=True)
testing.drop('PassengerId', axis=1, inplace=True)
testing.drop('Name', axis=1, inplace=True)
testing.drop('Ticket', axis=1, inplace=True)

final_test = testing
final_test.info()
<class 'pandas.core.frame.DataFrame'>
RangeIndex: 418 entries, 0 to 417
Data columns (total 11 columns):
 #   Column       Non-Null Count  Dtype
---  ------       --------------  -----
 0   Age          418 non-null    float64
 1   Fare         418 non-null    float64
 2   TravelAlone  418 non-null    int64
 3   IsMinor      418 non-null    int64
 4   Pclass_1     418 non-null    uint8
 5   Pclass_2     418 non-null    uint8
 6   Pclass_3     418 non-null    uint8
 7   Embarked_C   418 non-null    uint8
 8   Embarked_Q   418 non-null    uint8
 9   Embarked_S   418 non-null    uint8
 10  Sex_male     418 non-null    uint8
dtypes: float64(2), int64(2), uint8(7)
memory usage: 16.0 KB
(6) 피처 선택 (Feature Selection)
- Feature Selection을 통해 학습을 진행한다.
- 방법론: Recursive Feature Elimination (RFE)
- 참조: http://scikit-learn.org/stable/modules/feature_selection.html
- 목적, Backward 방식 중 하나로, 모든 변수를 우선 다 포함시킨 후 반복해서 학습을 진행하면서 중요도가 낮은 변수를 하나씩 제거하는 방식.
from sklearn.linear_model import LogisticRegression
from sklearn.feature_selection import RFE

cols = ["Age","Fare","TravelAlone","Pclass_1","Pclass_2","Embarked_C","Embarked_S","Sex_male","IsMinor"]
X = final_train[cols]
y = final_train['Survived']
model = LogisticRegression()
rfe = RFE(model, 8) # 변수 8개만 선택
rfe = rfe.fit(X, y)
print('Selected features: %s' % list(X.columns[rfe.support_]))
Selected features: ['Age', 'TravelAlone', 'Pclass_1', 'Pclass_2', 'Embarked_C', 'Embarked_S', 'Sex_male', 'IsMinor']
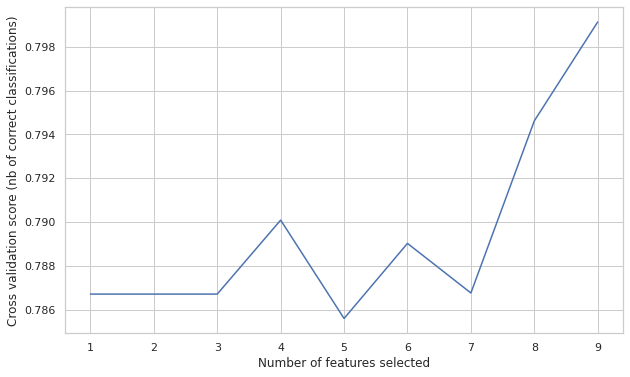
- 이번에는 변수의 갯수에 따라
classification정확도를 시각화 하여 변수의 개수를 정해본다.
from sklearn.feature_selection import RFECV
rfecv = RFECV(estimator=LogisticRegression(), step=1, cv=10, scoring='accuracy')
rfecv.fit(X, y)

print("Optimal number of features: %d" % rfecv.n_features_)
print('Selected features: %s' % list(X.columns[rfecv.support_]))

plt.figure(figsize=(10,6))
plt.xlabel("Number of features selected")
plt.ylabel("Cross validation score (nb of correct classifications)")
plt.plot(range(1, len(rfecv.grid_scores_) + 1), rfecv.grid_scores_)
plt.show()
Optimal number of features: 9
Selected features: ['Age', 'Fare', 'TravelAlone', 'Pclass_1', 'Pclass_2', 'Embarked_C', 'Embarked_S', 'Sex_male', 'IsMinor']

- 해당 주요 변수를
Selected_features로 저장한다.
Selected_features = ['Age', 'TravelAlone', 'Pclass_1', 'Pclass_2', 'Embarked_C',
                     'Embarked_S', 'Sex_male', 'IsMinor']
III. 머신러닝
- 로지스틱 회귀모형을 통해 머신러닝을 수행한다.
(1) 머신러닝 모형 개발
- 데이터셋 분리 부터 모형 개발까지 진행해본다.
from sklearn.model_selection import train_test_split, cross_val_score
from sklearn.metrics import accuracy_score, classification_report, precision_score, recall_score
from sklearn.metrics import confusion_matrix, precision_recall_curve, roc_curve, auc, log_loss

# 데이터 셋 분리
X = final_train[Selected_features]
y = final_train['Survived']

X_train, X_test, y_train, y_test = train_test_split(X, y, test_size=0.2, random_state=2)

# 로지스틱 회귀모형
logreg = LogisticRegression()
logreg.fit(X_train, y_train)
y_pred = logreg.predict(X_test)
y_pred_proba = logreg.predict_proba(X_test)[:, 1]
[fpr, tpr, thr] = roc_curve(y_test, y_pred_proba)
print('Train/Test split results:')
print(logreg.__class__.__name__+" accuracy is %2.3f" % accuracy_score(y_test, y_pred))
print(logreg.__class__.__name__+" log_loss is %2.3f" % log_loss(y_test, y_pred_proba))
print(logreg.__class__.__name__+" auc is %2.3f" % auc(fpr, tpr))

idx = np.min(np.where(tpr > 0.95)) # threshold

plt.figure()
plt.plot(fpr, tpr, color='coral', label='ROC curve (area = %0.3f)' % auc(fpr, tpr))
plt.plot([0, 1], [0, 1], 'k--')
plt.plot([0,fpr[idx]], [tpr[idx],tpr[idx]], 'k--', color='blue')
plt.plot([fpr[idx],fpr[idx]], [0,tpr[idx]], 'k--', color='blue')
plt.xlim([0.0, 1.0])
plt.ylim([0.0, 1.05])
plt.xlabel('False Positive Rate (1 - specificity)', fontsize=14)
plt.ylabel('True Positive Rate (recall)', fontsize=14)
plt.title('Receiver operating characteristic (ROC) curve')
plt.legend(loc="lower right")
plt.show()

print("Using a threshold of %.3f " % thr[idx] + "guarantees a sensitivity of %.3f " % tpr[idx] +
      "and a specificity of %.3f" % (1-fpr[idx]) +
      ", i.e. a false positive rate of %.2f%%." % (np.array(fpr[idx])*100))
Train/Test split results:
LogisticRegression accuracy is 0.782
LogisticRegression log_loss is 0.504
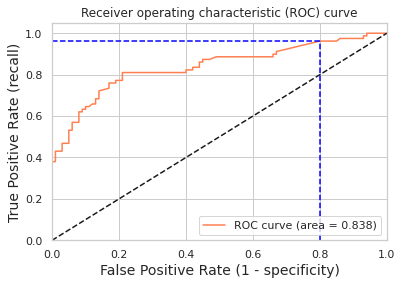
LogisticRegression auc is 0.838

Using a threshold of 0.070 guarantees a sensitivity of 0.962 and a specificity of 0.200, i.e. a false positive rate of 80.00%.
- 혼동행렬 및,
AUC,ROC Curve에 대한 설명은 강의 자료를 참조한다.
(2) 예측 테이블 생성
- 예측 테이블을 만들어 제출한다.
final_test['Survived'] = logreg.predict(final_test[Selected_features])
final_test['PassengerId'] = test['PassengerId']
submission = final_test[['PassengerId','Survived']]
submission.to_csv("submission.csv", index=False)
print(submission.tail())
     PassengerId  Survived
413         1305         0
414         1306         1
415         1307         0
416         1308         0
417         1309         0
