Plot Tree 색상 변경
Page content
개요
- skleran.tree.plot_tree의 색상을 바꿔보도록 한다.
- matplotlib 객체지향의 구조를 알면 어렵지(?) 않게 바꿀 수 있다.
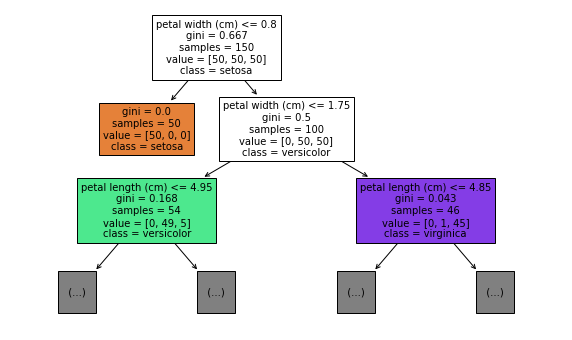
- 간단하게 plot_tree 시각화를 구현해본다.
- 언제나 예제로 희생당하는 iris 데이터에게 애도를 표한다.
- 구글코랩에서 실행 시, 다음 코드를 실행하여 최신 라이브러리로 업그레이드 한다.
!pip install -U matplotlib
Requirement already satisfied: matplotlib in /usr/local/lib/python3.7/dist-packages (3.2.2)
Collecting matplotlib
Downloading matplotlib-3.5.1-cp37-cp37m-manylinux_2_5_x86_64.manylinux1_x86_64.whl (11.2 MB)
[K |████████████████████████████████| 11.2 MB 27.0 MB/s
[?25hRequirement already satisfied: kiwisolver>=1.0.1 in /usr/local/lib/python3.7/dist-packages (from matplotlib) (1.4.0)
Requirement already satisfied: python-dateutil>=2.7 in /usr/local/lib/python3.7/dist-packages (from matplotlib) (2.8.2)
Requirement already satisfied: numpy>=1.17 in /usr/local/lib/python3.7/dist-packages (from matplotlib) (1.21.5)
Requirement already satisfied: pillow>=6.2.0 in /usr/local/lib/python3.7/dist-packages (from matplotlib) (7.1.2)
Requirement already satisfied: pyparsing>=2.2.1 in /usr/local/lib/python3.7/dist-packages (from matplotlib) (3.0.7)
Requirement already satisfied: cycler>=0.10 in /usr/local/lib/python3.7/dist-packages (from matplotlib) (0.11.0)
Requirement already satisfied: packaging>=20.0 in /usr/local/lib/python3.7/dist-packages (from matplotlib) (21.3)
Collecting fonttools>=4.22.0
Downloading fonttools-4.31.2-py3-none-any.whl (899 kB)
[K |████████████████████████████████| 899 kB 50.5 MB/s
[?25hRequirement already satisfied: typing-extensions in /usr/local/lib/python3.7/dist-packages (from kiwisolver>=1.0.1->matplotlib) (3.10.0.2)
Requirement already satisfied: six>=1.5 in /usr/local/lib/python3.7/dist-packages (from python-dateutil>=2.7->matplotlib) (1.15.0)
Installing collected packages: fonttools, matplotlib
Attempting uninstall: matplotlib
Found existing installation: matplotlib 3.2.2
Uninstalling matplotlib-3.2.2:
Successfully uninstalled matplotlib-3.2.2
[31mERROR: pip's dependency resolver does not currently take into account all the packages that are installed. This behaviour is the source of the following dependency conflicts.
albumentations 0.1.12 requires imgaug<0.2.7,>=0.2.5, but you have imgaug 0.2.9 which is incompatible.[0m
Successfully installed fonttools-4.31.2 matplotlib-3.5.1
%matplotlib inline

import sklearn
print(sklearn.__version__)
import matplotlib
print(matplotlib.__version__)

# 필수 라이브러리 불러오기
from sklearn.datasets import load_iris
from sklearn import tree
import matplotlib.pyplot as plt

# 데이터 불러오기
iris = load_iris()
print(iris.data.shape, iris.target.shape)
print("feature names", iris.feature_names)
print("class names", iris.target_names)

# 모형 학습 및 plot_tree 그래프 구현
dt = tree.DecisionTreeClassifier(random_state=0)
dt.fit(iris.data, iris.target)

fig, ax = plt.subplots(figsize=(10, 6))
ax = tree.plot_tree(dt, max_depth = 2, filled=True, feature_names = iris.feature_names, class_names = iris.target_names)
plt.show()
1.0.2
3.5.1
(150, 4) (150,)
feature names ['sepal length (cm)', 'sepal width (cm)', 'petal length (cm)', 'petal width (cm)']
class names ['setosa' 'versicolor' 'virginica']

plot_tree의 내부 구조
- 여기에서 필자는 위 그림들을 변경하고 싶었다.
- 어떻게 변경하면 될까? 변경을 하기 위해서는 plot_tree를 객체로 담은 ax를 분해하도록 한다.
- 내부 구조를 보면 Matplotlib 라이브러리의 text.Annotation 클래스로 구성이 되어 있는 것을 확인할 수 있다.
%matplotlib inline
fig, ax = plt.subplots(figsize=(10, 6))
ax = tree.plot_tree(dt, max_depth = 2,
                    filled=True,
                    feature_names = iris.feature_names,
                    class_names = iris.target_names)

for i in range(0, len(ax)):
  print(type(ax[i]))
<class 'matplotlib.text.Annotation'>
<class 'matplotlib.text.Annotation'>
<class 'matplotlib.text.Annotation'>
<class 'matplotlib.text.Annotation'>
<class 'matplotlib.text.Annotation'>
<class 'matplotlib.text.Annotation'>
<class 'matplotlib.text.Annotation'>
<class 'matplotlib.text.Annotation'>
<class 'matplotlib.text.Annotation'>

Annotation 클래스
- Annotation 클래스의 공식문서 주소는 다음과 같다.
- 이번에는 각 박스에 접근해서 스타일의 변화를 주도록 한다.
- 각 노드의 순서별로 접근 한 후, 홀수와 짝수 boxstyle에 변화를 주도록 한다.
- 이 부분에서 특별히 강조하고 싶은 노드가 있다면 순서로 접근해서 처리할 수 있다.
%matplotlib inline
fig, ax = plt.subplots(figsize=(10, 6))
ax = tree.plot_tree(dt, max_depth = 2,
                    filled=True,
                    feature_names = iris.feature_names,
                    class_names = iris.target_names)

for i in range(0, len(ax)):
  if i % 2 == 0:
    # set_boxtyle 적용
    ax[i].get_bbox_patch().set_boxstyle("round", pad=0.3)
  else:
    ax[i].get_bbox_patch().set_boxstyle("sawtooth", pad=0.3)

색상 변경
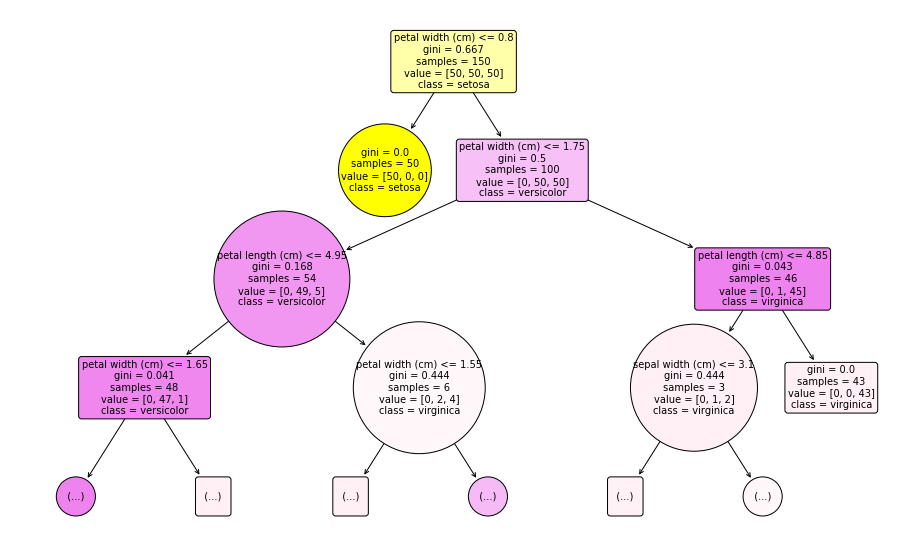
- 이번에는 set_facecolor의 색상에 변화를 주도록 한다.
- 이 때, 색상 변화는 impurity 값과, value값에 따라 변화를 주도록 해본다.
- 먼저 impurity와 value값을 각각 확인하도록 한다.
print("impurity", dt.tree_.impurity[:3])
print("--")
print("value", dt.tree_.value[:3])
impurity [0.66666667 0.         0.5       ]
--
value [[[50. 50. 50.]]

 [[50.  0.  0.]]

 [[ 0. 50. 50.]]]
- 색상 3개 중 최댓값이 선택하도록 만들도록 한다.
import numpy as np

colors = ["indigo", "violet", "crimson"]
print(colors[np.argmax([[0., 0., 50.]])])
print(colors[np.argmax([[50., 0., 0.]])])
print(colors[np.argmax([[0., 50., 0.]])])
print(colors[np.argmax([[50., 50., 50.]])])
crimson
indigo
violet
indigo
- 그 후에 to_rgb 색상 값으로 변환하여 별도로 저장한다.
- 저장한 값들은 set_facecolor()에 반영할 것이다.
- color 색상을 직접 입혀도 되고, 아님 rgb 스타일로 넣어줘도 된다.
- 같은 종으로 분류를 하더라도 impurity 값에 따라 진하게 또는 옅하게 방식으로 색상을 구분하기 위해 약간의 트릭을 주었다.
- 전체 코드는 아래와 같다.
%matplotlib inline

import sklearn
print(sklearn.__version__)
import matplotlib
print(matplotlib.__version__)

from matplotlib.colors import to_rgb
from sklearn.datasets import load_iris
from sklearn import tree
import matplotlib.pyplot as plt
import numpy as np

# 데이터 불러오기
iris = load_iris()
print(iris.data.shape, iris.target.shape)

# 모형 학습 및 plot_tree 그래프 구현
dt = tree.DecisionTreeClassifier(random_state=0)
dt.fit(iris.data, iris.target)

fig, ax = plt.subplots(figsize=(16, 10))
ax = tree.plot_tree(dt, max_depth = 3,
                    filled=True,
                    feature_names = iris.feature_names,
                    class_names = iris.target_names)

i = 0
# 색상 코드가 궁금하신 분들은 https://matplotlib.org/stable/gallery/color/named_colors.html
colors = ["yellow", "violet", "lavenderblush"]
for artist, impurity, value in zip(ax, dt.tree_.impurity, dt.tree_.value):
  r, g, b = to_rgb(colors[np.argmax(value)])
  # 코드가 길어서 i로 재 저장
  ip = impurity
  # print(ip + (1-ip)*r, ip + (1-ip)*g, ip + (1-ip)*b)

  # 노드의 순서에 홀짝으로 구분하여 스타일에 변화를 주었다.
  # 홀짝 구분의 의미는 없다.
  if i % 2 == 0:
    # set_boxtyle 적용
    artist.get_bbox_patch().set_boxstyle("round", pad=0.3)
  else:
    artist.get_bbox_patch().set_boxstyle("circle", pad=0.3)

  # 색상 입히기
  ax[i].get_bbox_patch().set_facecolor((ip + (1-ip)*r, ip + (1-ip)*g, ip + (1-ip)*b))
  ax[i].get_bbox_patch().set_edgecolor('black')
  i = i+1
1.0.2
3.5.1
(150, 4) (150,)

추가작업을 위한 공부
- dt.tree_ 클래스 내부에는 다양한 값들이 저장이 되어 있다.
- 기회가 된다면 다음 글을 읽어보면 도움이 될 것이다.
- Understanding the decision tree structure : https://scikit-learn.org/stable/auto_examples/tree/plot_unveil_tree_structure.html
