(Python-Plotly) Plotly 그래프 깃헙 블로그에 올리기
Page content
강의 홍보
- 취준생을 위한 강의를 제작하였습니다.
- 본 블로그를 통해서 강의를 수강하신 분은 게시글 제목과 링크를 수강하여 인프런 메시지를 통해 보내주시기를 바랍니다.
스타벅스 아이스 아메리카노를 선물로 보내드리겠습니다.
- [비전공자 대환영] 제로베이스도 쉽게 입문하는 파이썬 데이터 분석 - 캐글입문기


개요
- 깃헙 브로그에 동적 시각화를 올리는 방법에 대해 기술한다.
- 현재까지 찾아낸 것은 이게 최선입니다! 더 나은 것이 있다면 공유 부탁드립니다. (꾸벅)
필수 라이브러리 설치
- 라이브러리를 설치합니다.
- Getting Started with Plotly in Python, https://plotly.com/python/getting-started/
- Getting Started with Chart Studio in Python, https://plotly.com/python/getting-started-with-chart-studio/
$ pip install plotly
$ pip install chart_studio
plotly의 역할 그래프를 작성하는 기본 도구이며,chart_studio의 역할은 그래프를plotly홈페이지 업로드 할 수 있도록 도와주고, 또한iframe output으로 변환하는 데 도움을 주는 코드이다.
step 01. 그래프 작성
- 그래프를 작성합니다.
import plotly.express as px
import chart_studio

gapminder = px.data.gapminder()
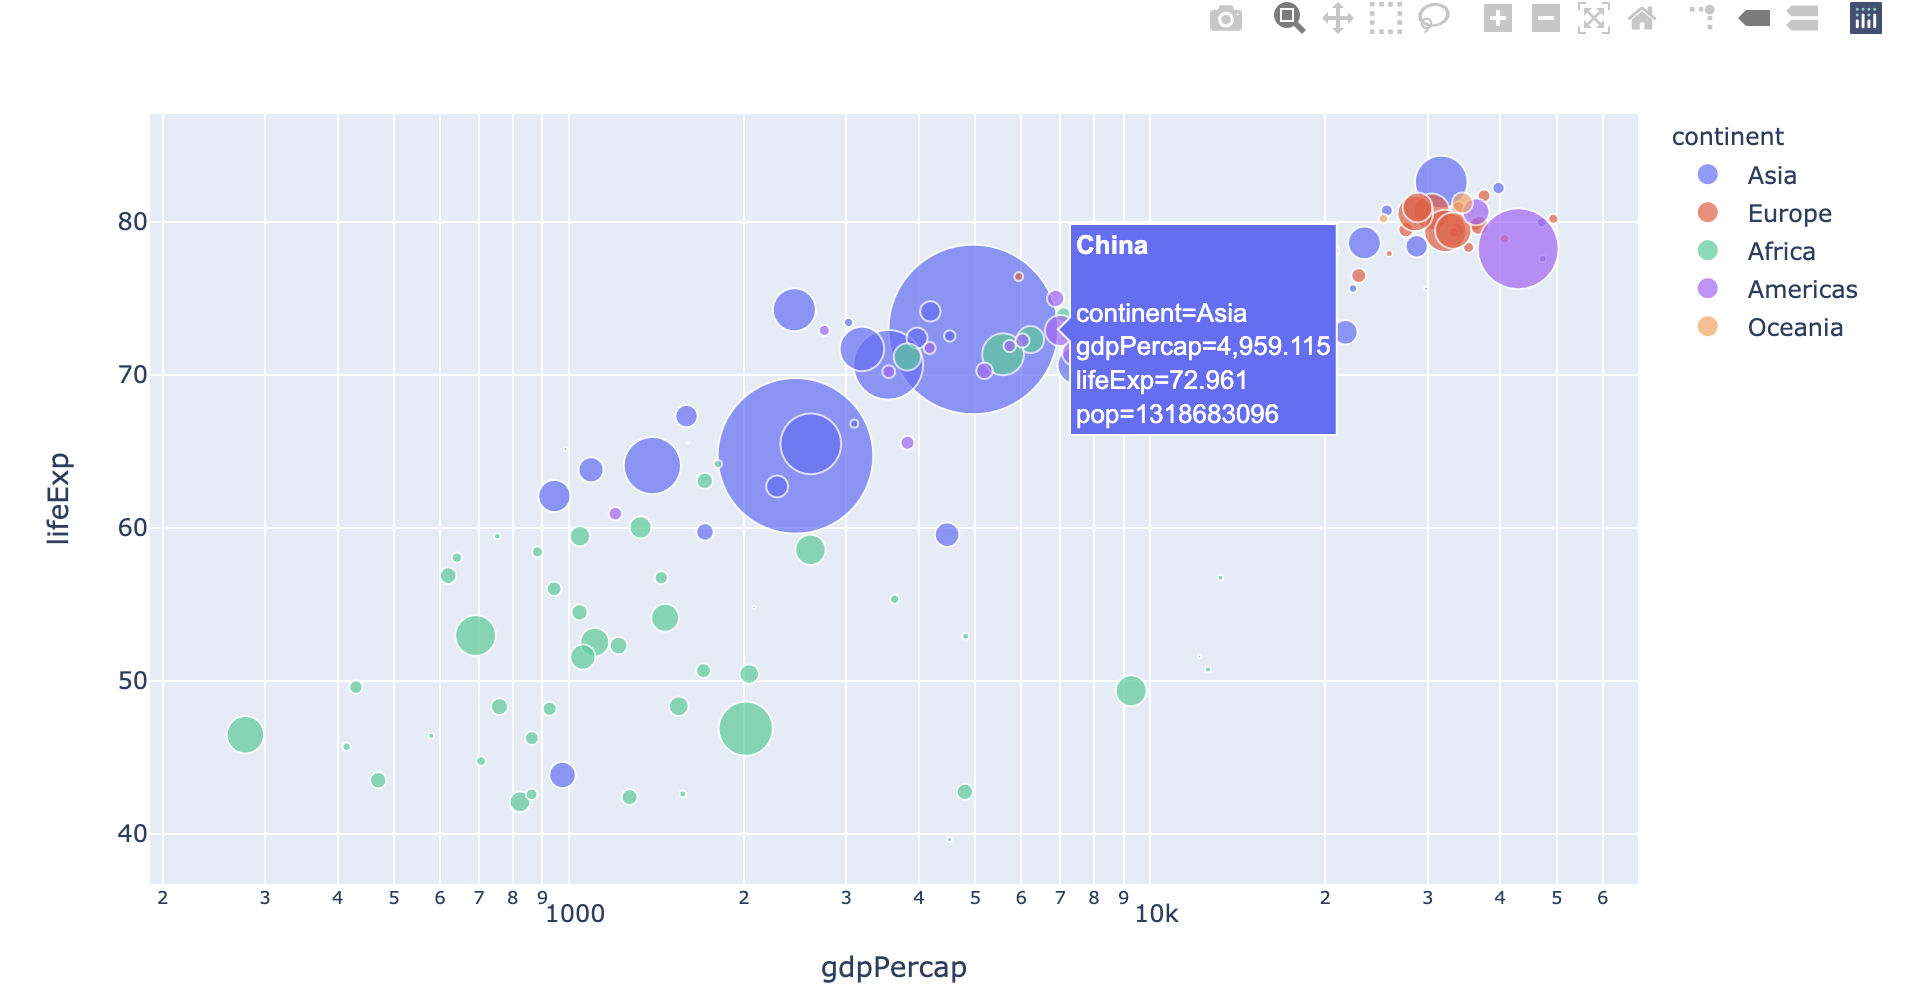
fig = px.scatter(gapminder.query("year==2007"), x="gdpPercap", y="lifeExp", size="pop", color="continent",
           hover_name="country", log_x=True, size_max=60)
fig.show()
- 위 출력물은 실제로는 동적 시각화로 구현이 됩니다만, 캡쳐하여 올려 놓습니다.
step 02. plotly 회원가입
-
해당 그래프를 이제 plotly 클라우드에 올려 놓기 위해서는 회원 가입을 진행해야 합니다.
-
회원가입을 완료된 후의 모습은 아래와 같습니다.

- 그 후에 우측 상단에 [프로필]-[Settings]-[API Keys]를 클릭한 후,
API Key를 발급받습니다.
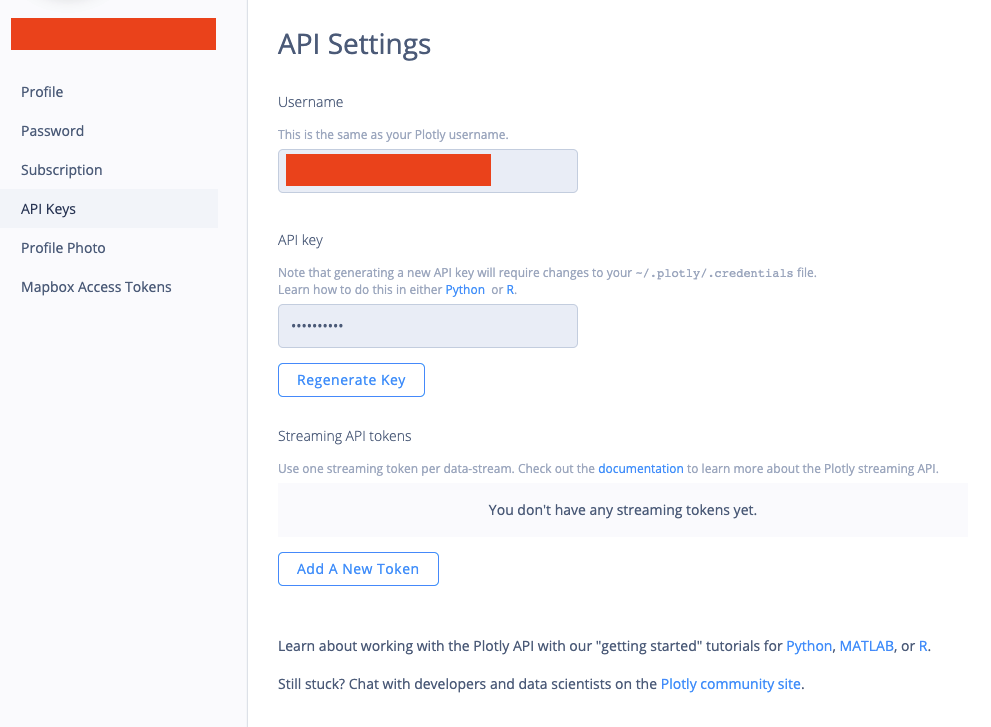
- 위 그림에서
Regenerate Key를 발급받습니다. - 그 후에 아래 코드로 연동하도록 합니다.
username = 'your_name' # your username
api_key = 'your_key' # your api key - go to profile > settings > regenerate key
chart_studio.tools.set_credentials_file(username=username, api_key=api_key)
step 03. 그래프 업로드
- 이제 그래프를 업로드를 하도록 합니다. 그러면 URL이 나타나게 됩니다.
import chart_studio.plotly as py
py.plot(fig, filename = 'gdp_per_cap', auto_open=True)
'https://plotly.com/~jhjung/1/'
- 실제로 위 주소를 복사하여 주소창에 입력하면, 연결이 됩니다.
step 04. iframe 변환
- 이제 iframe으로 변환하여 해당 코드를 출력합니다.
import chart_studio.tools as tls
tls.get_embed('https://plotly.com/~jhjung/1/') #change to your url
'<iframe id="igraph" scrolling="no" style="border:none;" seamless="seamless" src="https://plotly.com/~jhjung/1.embed" height="525" width="100%"></iframe>'
step 05. github 블로그 적용
- 이제 깃헙 블로그에 적용하도록 합니다.
Case 1. Hugo 블로그
- 먼저 필자의 블로그인
Hugo블로그에 적용합니다. - 필자는 html 파일을 새로 만들었습니다.
- 경로: themes/mainroad/layouts/shortcodes/your_path/plotly_01.html
<iframe id="igraph" scrolling="no" style="border:none;" seamless="seamless" src="https://plotly.com/~jhjung/1.embed" height="525" width="100%"></iframe>
- md 파일에 적용하면 아래 그림처럼 포스트 안에 그래프가 올라가는 것을 확인할 수 있습니다.
shortcodes에 대한 설명은 다음 링크에서 확인합니다.
Case 2. Hexo 블로그
-
Hexo 블로그는
Tag Plugins방식으로 추가할 수 있습니다. -
이제 코드를 작성합니다.
...(본문 내용)

```python
import plotly.express as px
import chart_studio
gapminder = px.data.gapminder()
fig = px.scatter(gapminder.query("year==2007"), x="gdpPercap", y="lifeExp", size="pop", color="continent",
           hover_name="country", log_x=True, size_max=60)
fig.show()
```
{% iframe your_url %}

...(본문 내용)
- 위와 같이 올리면, 추가할 수 있습니다. 아래는
Hexo에서icarus테마를 적용한 것입니다.
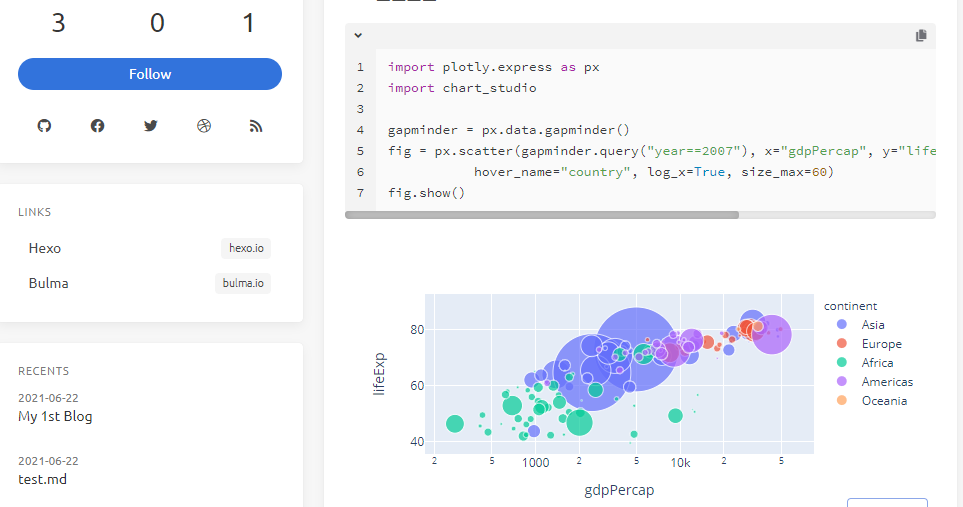
- 위 그림에서 보는 것처럼 정상적으로
plotly그래프가 올라간 것을 확인할 수 있습니다.
References
Elizabeth Ter Sahakyan. (2019). How To Create a Plotly Visualization And Embed It On Websites. Towards Data Science. Retrieved from https://towardsdatascience.com/how-to-create-a-plotly-visualization-and-embed-it-on-websites-517c1a78568b
