Plotly 그래프 - 막대 그래프 색상 변경
Page content
개요
- 특정 컬럼의 색상을 변경하는 코드를 작성한다.
기본 그래프 작성
- 우선 아래와 같은 기본 그래프를 작성한다.
import plotly.express as px

tips = px.data.tips()
tips_mean_day = tips.groupby("day").mean().reset_index()
tips_mean_day.head()

fig = px.bar(tips_mean_day, x = 'day', y = 'tip')
fig.show()

Sun 색상 변경
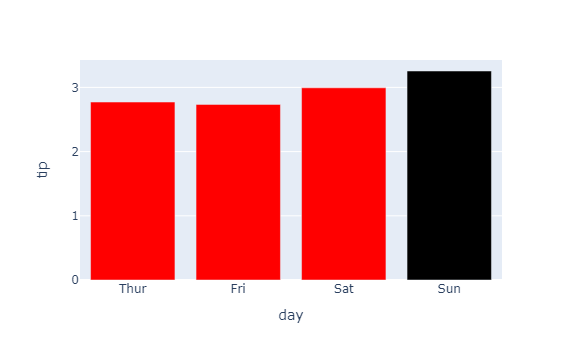
- Sun 값의 막대 그래프의 색상을 변경하도록 한다.
- 먼저 marker.color를 활용하여 색상을 먼저 지정한 뒤, X축 라벨의 순서를 후에 재정렬한 것이다.
fig.data[0].marker.color = ['#ff0000', '#ff0000', 'black', '#ff0000']
fig.layout.xaxis.categoryarray = ["Thur", "Fri", "Sat", "Sun"]
fig.show()

투명도 설정
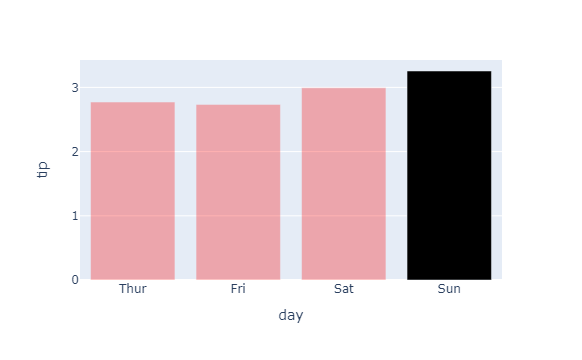
- Sun을 제외한 나머지 컬럼에 대한 투명도를 설정한다.
fig.data[0].marker.color = ['#ff0000', '#ff0000', 'black', '#ff0000']
fig.data[0].marker.opacity = [0.3, 0.3, 1, 0.3]
fig.layout.xaxis.categoryarray = ["Thur", "Fri", "Sat", "Sun"]
fig.show()

그래프 background color 변경
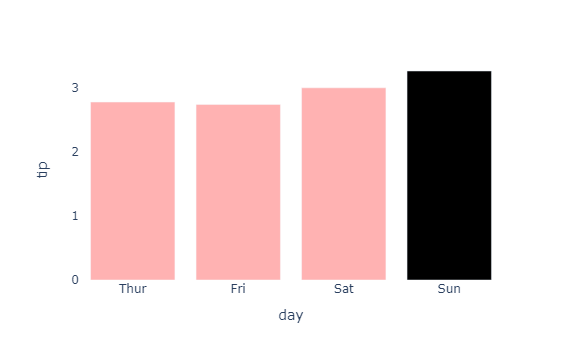
- 이번에는 그래프의 background color 색상을 흰색으로 변경한다.
fig.data[0].marker.color = ['#ff0000', '#ff0000', 'black', '#ff0000']
fig.data[0].marker.opacity = [0.3, 0.3, 1, 0.3]
fig.layout.xaxis.categoryarray = ["Thur", "Fri", "Sat", "Sun"]
fig.layout.template.layout.plot_bgcolor = '#ffffff'
fig.show()

막대 그래프의 외관 색상 변경
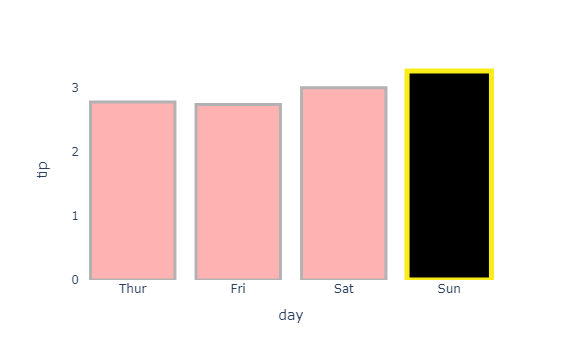
- 이번에는 Thur, Fri, Sat 그래프의 외곽 색상에는 검은색을 추가한다.
- Sun 그래프의 외곽 색상에는 다른색상을 추가한다.
fig.data[0].marker.color = ['#ff0000', '#ff0000', 'black', '#ff0000']
fig.data[0].marker.opacity = [0.3, 0.3, 1, 0.3]
fig.data[0].marker.line.color = ['#000000', '#000000', '#FAEC19', '#000000']
fig.data[0].marker.line.width = [3, 3, 5, 3]
fig.layout.xaxis.categoryarray = ["Thur", "Fri", "Sat", "Sun"]
fig.layout.template.layout.plot_bgcolor = '#ffffff'
fig.show()

