Plotly 그래프 - 막대 그래프 X축 라벨 변경하기
Page content
개요
- 기존에 작성한 그래프를 목적에 맞게 수정 및 변경할 수 있다.
- Figure Object를 활용한다.
데이터 불러오기 및 가공
- tips 데이터를 불러온 뒤, 데이터를 가공하여 평균 값을 구한다.
import plotly.express as px

tips = px.data.tips()
tips_mean_day = tips.groupby("day").mean().reset_index()
tips_mean_day.head()

막대 그래프 작성하기
- 기본 막대그래프를 작성한다.
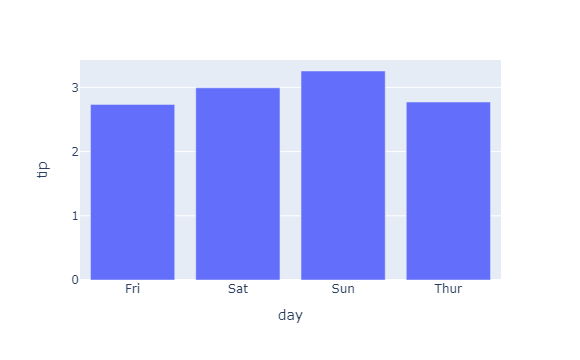
- 그런데, X축의 값을 보면 요일별로 정리가 안된 것을 확인할 수 있다. 이 부분을 수정하도록 한다.
fig = px.bar(tips_mean_day, x = 'day', y = 'tip')
fig.show()

막대 그래프의 X 라벨 변경하기
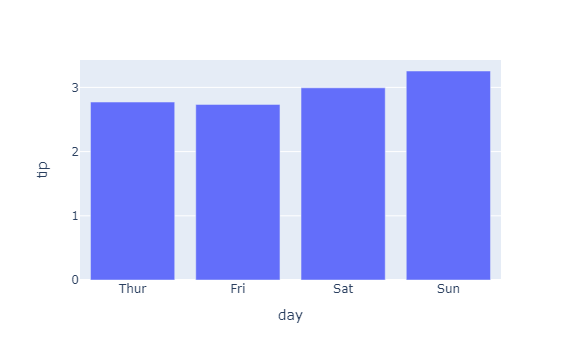
- 우선 막대그래프의 순서를 변경하도록 한다. 세가지 방법이 있다. 첫번째는 최초 그래프를 생성할 때, category_orders 에 그래프의 순서를 지정하는 방법이 있다.
fig = px.bar(tips_mean_day, x = 'day', y = 'tip', category_orders={"day": ["Thur", "Fri", "Sat", "Sun"]})
fig.show()

- 마지막으로 update_xaxes를 활용하는 방법이다.
fig = px.bar(tips_mean_day, x = 'day', y = 'tip')
fig.update_xaxes(categoryorder='array', categoryarray=["Thur", "Fri", "Sat", "Sun"])
fig.show()

- 세번째는 fig.layout을 활용하여 변경하는 방법이다.
fig = px.bar(tips_mean_day, x = 'day', y = 'tip')
fig.layout.xaxis.categoryarray = ["Thur", "Fri", "Sat", "Sun"]
fig.show()

