Plotly 그래프 - Plotly Express
Page content
개요
- High-Level API 형태인 Plotly Express에 대해 학습하도록 한다.
Plotly Express는 간단하게 말하면Pandas Dataframe과 직접적으로 연동이 가능하다.- 보다 직관적으로 그래프를 시각화할 수 있기 때문에 초기 밑그림을 그릴 때는
Plotly Express로 작성하는 것이 좋다. - 전체 설명 참고자료 : Plotly Express in Python
Plotly Express 요약
- Plotly Express Function은 graph_objects를 기반으로 작성되며, 그래프의 반환값도
plotly.graph_objects형태이다. - 공식 문서에는 약 30개 이상이 그래프 유형이 존재하는 것으로 알려지고 있다.
Plotly Express 그래프 종류
Plotly Express currently includes the following functions:
- Basics: scatter, line, area, bar, funnel, timeline
- Part-of-Whole: pie, sunburst, treemap, icicle, funnel_area
- 1D Distributions: histogram, box, violin, strip, ecdf
- 2D Distributions: density_heatmap, density_contour
- Matrix or Image Input:imshow
- 3-Dimensional: scatter_3d, line_3d
- Multidimensional: scatter_matrix, parallel_coordinates, parallel_categories
- Tile Maps: scatter_mapbox, line_mapbox, choropleth_mapbox, density_mapbox
- Outline Maps: scatter_geo, line_geo, choropleth
- Polar Charts: scatter_polar, line_polar, bar_polar
- Ternary Charts: scatter_ternary, line_ternary
Plotly Express 그래프 주요 특징
-
High-Level Features 원어
- A single entry point into plotly: justimport plotly.express as px and get access to all the plotting functions, plus built-in demo datasets under px.data and built-in color scales and sequences under px.color. Every PX function returns a plotly.graph_objects.Figure object, so you can edit it using all the same methods likeupdate_layout and add_trace.
- Sensible, Overridable Defaults: PX functions will infer sensible defaults wherever possible, and will always let you override them.
- Flexible Input Formats: PX functions accept input in a variety of formats, from lists and dicts to long-form or wide-form Pandas DataFrames to numpy arrays andxarrays to GeoPandasGeoDataFrames.
- Automatic Trace and Layout configuration: PX functions will create one trace per animation frame for each unique combination of data values mapped to discrete color, symbol, line-dash, facet-row and/or facet-column. Traces legendgroup and showlegend attributes are set such that only one legend item appears per unique combination of discrete color, symbol and/or line-dash. Traces are automatically linked to a correctly-configured subplot of the appropriate type.
- Automatic Figure Labelling: PX functions label axes, legends and colorbars based in the inputDataFrame’ or xarray, and provide extra control with the labels argument.
- Automatic Hover Labels: PX functions populate the hover-label using the labels mentioned above, and provide extra control with thehover_name andhover_data arguments.
- Styling Control: PX functions read styling information from the default figure template, and support commonly-needed cosmetic controls like category_orders and color_discrete_map to precisely control categorical variables.
- Uniform Color Handling: PX functions automatically switch between continuous and categorical color based on the input type.
- Faceting: the 2D-cartesian plotting functions support row, column and wrapped facetting with facet_row, facet_col and facet_col_wrap arguments.
- Marginal Plots: the 2D-cartesian plotting functions support marginal distribution plots with the marginal, marginal_x and marginal_y arguments.
- A Pandas backend: the 2D-cartesian plotting functions are available as a Pandas plotting backend so you can call them via df.plot()`.
- Trendlines: px.scatter supports built-in trend lines with accessible model output.
- Animations: many PX functions support simple animation support via the animation_frame and animation_group arguments.
- Automatic WebGL switching: for sufficiently large scatter plots, PX will automatically use WebGL for hardware-accelerated rendering.
-
위와 같이 여러 특징이 있지만, 가장 큰 핵심은 다음 설명임.
- 1줄로 요약하면, Express Function은 기존 Figure Object과 같은 방식으로 수정이 가능하다는 것.
A single entry point into plotly: just import plotly.express as px and get access to all the plotting functions, plus built-in demo datasets under px.data and built-in color scales and sequences under px.color. Every PX function returns a plotly.graph_objects.Figure object, so you can edit it using all the same methods likeupdate_layout and add_trace.
그래프 작성법
- 그래프 작성법은 매우 간단하며,
Seaborn과 유사하다고 보면 된다.- seaborn : https://seaborn.pydata.org/
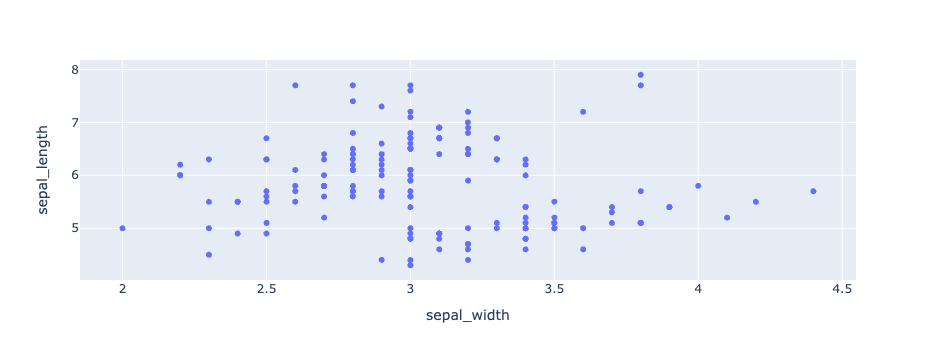
- iris 데이터를 불러와서 산점도를 작성하도록 한다.
import plotly.express as px

iris = px.data.iris() # 데이터를 불러온다.
iris.info()
<class 'pandas.core.frame.DataFrame'>
RangeIndex: 150 entries, 0 to 149
Data columns (total 6 columns):
 #   Column        Non-Null Count  Dtype
---  ------        --------------  -----
 0   sepal_length  150 non-null    float64
 1   sepal_width   150 non-null    float64
 2   petal_length  150 non-null    float64
 3   petal_width   150 non-null    float64
 4   species       150 non-null    object
 5   species_id    150 non-null    int64
dtypes: float64(4), int64(1), object(1)
memory usage: 7.2+ KB
- 그래프를 작성할 때, seaborn 처럼, 컬럼명만 알고 있으면 그래프가 자동으로 그려진다.
fig = px.scatter(iris, x="sepal_width", y="sepal_length")
fig.show()

그래프 수정
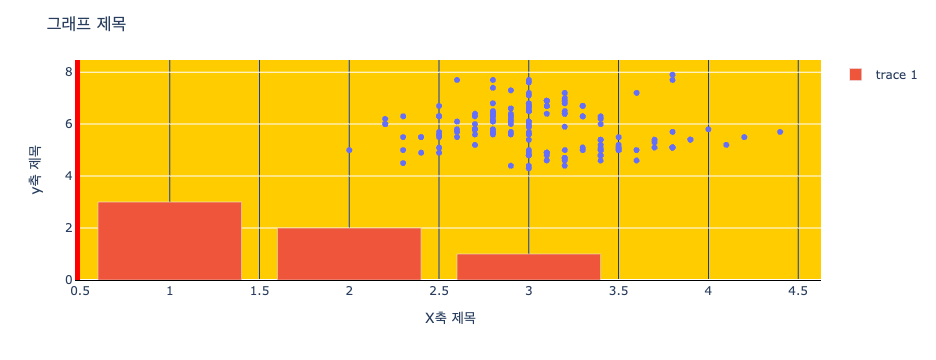
- 그렇다면, Figure Object 처럼, 테마 변경 등이 가능한지 확인하도록 한다.
- 이와 같이 자유자재로 컨트롤 할 수 있음을 알 수 있다.
fig.add_bar(x=[1, 2, 3], y = [3, 2, 1])
fig.layout.title = '그래프 제목'
fig.layout.xaxis.title = 'X축 제목'
fig.layout.yaxis.title = 'y축 제목'
fig.layout.template.layout.plot_bgcolor = '#FFCC00'
fig.layout.xaxis.gridcolor = '#0F3DB8'
fig.layout.xaxis.linecolor = 'black'
fig.layout.yaxis.linecolor = 'red'
fig.layout.yaxis.linewidth = 5
fig.show()

