Python Dash를 활용한 대시보드에서 엑셀 데이터로 다운로드 받기
Page content
강의 홍보
- 취준생을 위한 강의를 제작하였습니다.
- 본 블로그를 통해서 강의를 수강하신 분은 게시글 제목과 링크를 수강하여 인프런 메시지를 통해 보내주시기를 바랍니다.
스타벅스 아이스 아메리카노를 선물로 보내드리겠습니다.
- [비전공자 대환영] 제로베이스도 쉽게 입문하는 파이썬 데이터 분석 - 캐글입문기
[대시보드] Dash Project - Excel 다운로드
개요
- 각 레벨에 따라 달라지는 데이터를 시각화로 표현하고 결과치를 엑셀로 다운로드 받는 기능을 구현한다.
데이터 다운로드
- 데이터는
로그 분석을 통한 보안 위험도 예측 AI 경진대회에서 가져왔다. (회원가입 필수) - 데이터는 train 데이터만 활용한다.
import pandas as pd
train_df = pd.read_csv("train.csv")

id  level                                           full_log
0   0      0  Sep 24 10:02:22 localhost kibana: {"type":"err...
1   1      0  Feb  8 16:21:00 localhost logstash: [2021-02-0...
2   2      0  Jan 13 01:50:40 localhost kibana: {"type":"err...
3   3      0  Jan  4 10:18:31 localhost kibana: {"type":"err...
4   4      1  type=SYSCALL msg=audit(1603094402.016:52981): ...
함수 작성
- 각 레벨에 따른 첫번째 글자수의 빈도를 구하는 데이터를 구하도록 한다.
- 예를 들면, level 1에 대한 첫번째 글자 수를 집계한 결과는 아래와 같다.
- 아래와 같은 결과값이 나오는 함수를 작성할 것이다.
index     cnt
0  type=SYSCALL  116496
1           Jan    3019
2           Oct    2904
3           Nov    2646
4           Feb    2381
- 먼저 함수를 작성해본다.
def get_df(data, level=0):

    # pandas dataframe
    lvl_df = data.loc[data.level == level].full_log.apply(lambda x: x.split(' ')[0]).value_counts().rename(
        'cnt').to_frame().reset_index()

    return lvl_df

data = get_df(train_df, level = 1)
print(data.head())
index     cnt
0  type=SYSCALL  116496
1           Jan    3019
2           Oct    2904
3           Nov    2646
4           Feb    2381
- 위 데이터를 토대로 시각화를 작성하고, 그 후에는 엑셀로 된 데이터로 변환하는 것이 목표이다.
- 이 때, 각 레벨의 값에 따라 데이터 결괏값과 시각화의 그림도 달라지게 된다.
프로젝트 폴더 정리
- 최종적인 프로젝트 폴더 및 파일은 아래와 같다.
C:.
│  .gitignore
│  app.py
│  README.md
│
│
├─assets
│      style.css
│
├─data
│      train.csv
(1) 데이터 불러오기
- 이제
app.py를 작성하도록 한다. - 먼저 데이터를 불러오는 코드 사용자 정의 함수는 다음과 같다.
import dash
import dash_table
import dash_core_components as dcc
import dash_html_components as html
import pandas as pd
from dash.dependencies import Input, Output

# 함수 정의
def get_df(data, level=0):
    # pandas dataframe
    lvl_df = data.loc[data.level == level].full_log.apply(lambda x: x.split(' ')[0]).value_counts().rename(
        'cnt').to_frame().reset_index()

    return lvl_df

DATA_PATH = "data/"
train_df = pd.read_csv(DATA_PATH + "train.csv")
print(train_df.head())

data = get_df(train_df, level=1)
print(data.head()) # 결과치가 잘 나오는지 확인하다.
level=1에서, 숫자를 변경하여 결괏값이 서로 다르게 나타나는지 반드시 확인하도록 한다.
(2) Dash 객체 생성
dash클래스를 호출화여 app 인스턴스화를 진행한다.- 또한,
app.title과app.layout작성한다.
.
.
external_stylesheets = [
    {
        "href": "https://fonts.googleapis.com/css2?"
                "family=Lato:wght@400;700&display=swap",
        "rel": "stylesheet",
    },
]
app = dash.Dash(__name__, external_stylesheets=external_stylesheets)
app.title = "Temp Analytics: Understand Your Data!"

app.layout = html.Div(
    html.P("Hello World")
)

if __name__ == "__main__":
	app.run_server(debug=True)
- 앱을 실행하면 아래와 같이 결괏값이 나타날 것이다.
id  level                                           full_log
0   0      0  Sep 24 10:02:22 localhost kibana: {"type":"err...
1   1      0  Feb  8 16:21:00 localhost logstash: [2021-02-0...
2   2      0  Jan 13 01:50:40 localhost kibana: {"type":"err...
3   3      0  Jan  4 10:18:31 localhost kibana: {"type":"err...
4   4      1  type=SYSCALL msg=audit(1603094402.016:52981): ...
          index     cnt
0  type=SYSCALL  116496
1           Jan    3019
2           Oct    2904
3           Nov    2646
4           Feb    2381
Dash is running on http://127.0.0.1:8050/
[http://127.0.0.1:8050/](http://127.0.0.1:8050/)을 클릭하면Hello World만 나타날 것이다.
(3) HTML 상단 머리글 입력
- 이제
HTML코드를 추가로 입력한다. - 이제
app.layout을 입력 하는 코드를 작성해보도록 한다. - HTML 코드는
DIV 태그가 기준이 된다. 따라서,DIV태그가 완성될 때마다 화면을 공유하도록 했다. - 먼저, 화면의 상단
DIV태그를 작업한다.
.
.
app.layout = html.Div(
	children=[
        html.Div(
            children=[
                html.P(children="📈", className="header_emoji"),
                html.H1(children="Temp Analytics", className="header_title", ),
                html.P(children="Temp", className="header_description", ),
            ],
            className='header',
        ),
	]
)
.
.
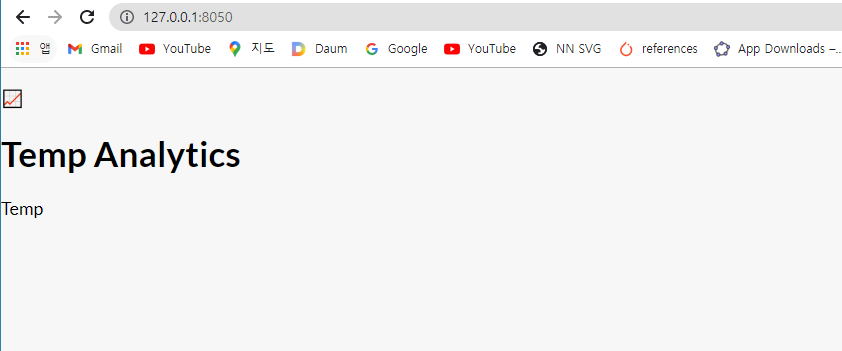
- 아직
style.css을 입히기 전의 화면을 보면 다음과 같이 출력될 것이다.
- 이번에는
style.css를 입혀본다.
body {
    font-family: "Lato", sans-serif;
    margin: 0;
    background-color: #F7F7F7;
}

.header {
    background-color: #222222;
    height: 288px;
    padding: 16px 0 0 0;
}

.header_emoji {
    font-size: 48px;
    margin: 0 auto;
    text-align: center;
}

.header_title {
    color: #FFFFFF;
    font-size: 48px;
    font-weight: bold;
    text-align: center;
    margin: 0 auto;
}

.header_description {
    color: #CFCFCF;
    margin: 4px auto;
    text-align: center;
    max-width: 384px;
}
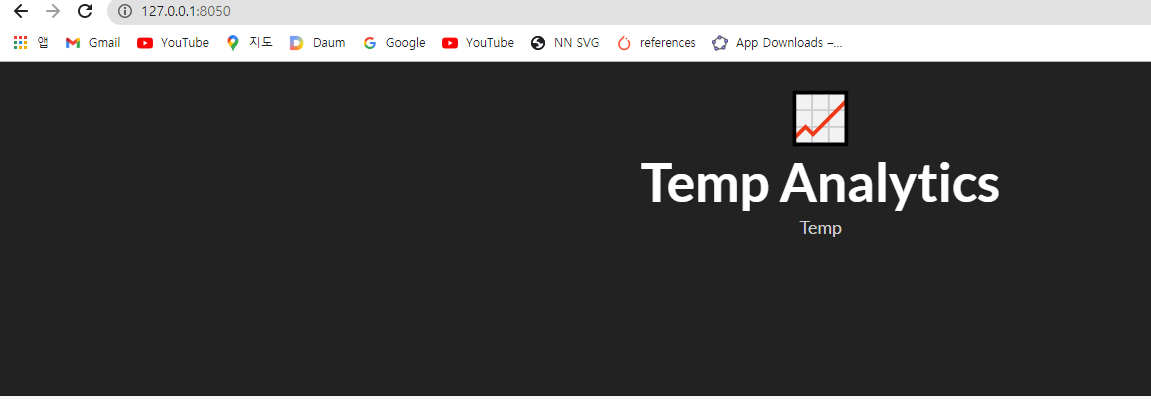
- 이제 다시 앱을 실행하면 아래와 같은 화면이 나타난다.
(4) Dropdown 메뉴 추가
- Dropdown 옵션에 대한 구체적인 설명은 다음 Dropdown Examples and Reference 에서 확인이 가능하다.
- 우선 본 코드에서는
Level 0 ~ 6까지 존재하기 때문에options을 별도로 설정한다.
.
.

app.layout = html.Div(
    children=[
        html.Div(
            children=[
                html.P(children="📈", className="header_emoji"),
                html.H1(children="Temp Analytics", className="header_title"),
                html.P(children="Temp", className="header_description", ),
            ],
            className="header",
        ),
        html.Div(
          children=[
              html.Div(
                  children=[
                        html.Div(children="Level", className="menu-title"),
                        dcc.Dropdown(id="level-dropdown",
                                     options=[
                                         {"label": 0, "value": 0},
                                         {"label": 1, "value": 1},
                                         {"label": 2, "value": 2},
                                         {"label": 3, "value": 3},
                                         {"label": 4, "value": 4},
                                         {"label": 5, "value": 5},
                                         {"label": 6, "value": 6},
                                     ],
                                     value=0,
                                     clearable=False,
                                     className="dropdown"),
                  ]
              ),
          ],
          className="menu"
        ),
    ],
)
.
.
- 이번에는 style.css 코드를 적용한 후, app을 실행한다.
.menu {
    height: 112px;
    width: 912px;
    display: flex;
    justify-content: space-evenly;
    padding-top: 24px;
    margin: -80px auto 0 auto;
    background-color: #FFFFFF;
    box-shadow: 0 4px 6px 0 rgba(0, 0, 0, 0.18);
}

.Select-control {
    width: 256px;
    height: 48px;
}

.Select--single > .Select-control .Select-value, .Select-placeholder {
    line-height: 48px;
}

.Select--multi .Select-value-label {
    line-height: 32px;
}

.menu-title {
    margin-bottom: 6px;
    font-weight: bold;
    color: #079A82;
}
- 앱을 실행하면 아래와 같은 결괏값을 확인할 수 있다.
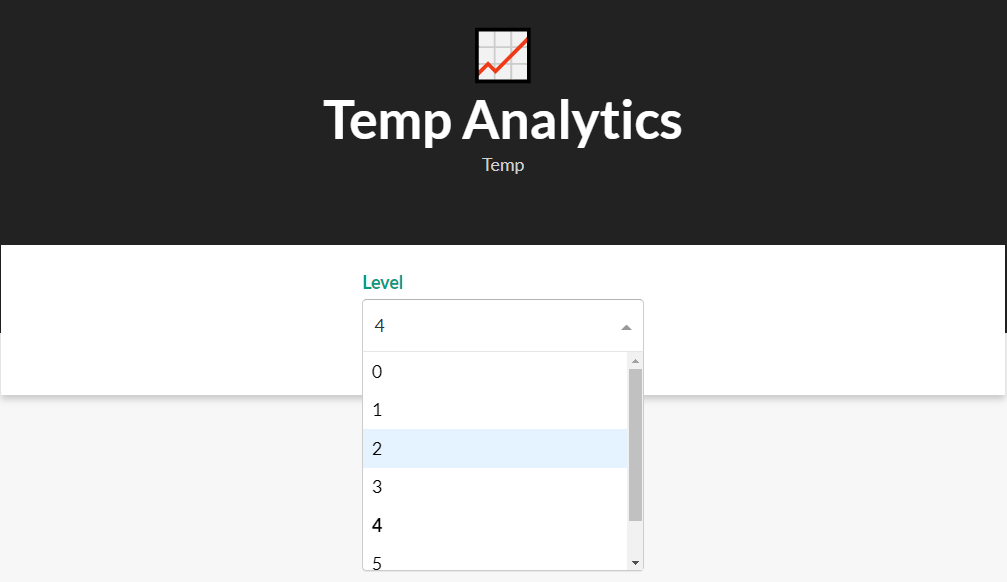
(5) 그래프 및 표 작성
- 드롭다운 메뉴와 관계 없이 일단, 그래프 및 테이블이 정상적으로 나타나는지 확인한다.
- 자세한 설명은 Graph Examples and Reference & Dash DataTable 를 확인한다.
- 기존 코드에서, 그래프와 테이블을 모두 담는
html.Div코드를 추가한다.- 그리고, 내부적으로 다시
html.Div(graph),html.Div(table)분리하도록 한다.
- 그리고, 내부적으로 다시
.
.
app.layout = html.Div(
    children=[
        html.Div(
            children=[
                html.P(children="📈", className="header_emoji"),
                html.H1(children="Temp Analytics", className="header_title"),
                html.P(children="Temp", className="header_description", ),
            ],
            className="header",
        ),
        html.Div(
          children=[
              html.Div(
                  children=[
                        html.Div(children="Level", className="menu-title"),
                        dcc.Dropdown(id="level-dropdown",
                                     options=[
                                         {"label": 0, "value": 0},
                                         {"label": 1, "value": 1},
                                         {"label": 2, "value": 2},
                                         {"label": 3, "value": 3},
                                         {"label": 4, "value": 4},
                                         {"label": 5, "value": 5},
                                         {"label": 6, "value": 6},
                                     ],
                                     value=0,
                                     clearable=False,
                                     className="dropdown"),
                  ]
              ),
          ],
          className="menu"
        ),
        # 그래프
        html.Div(
            children=[
                html.P("--- Graph ----"),
                html.Div(
                    children=dcc.Graph(
                        id="bar-chart",
                        config={"displayModeBar":False},
                        figure={
                            "data":[{
                                "x": data['index'],
                                "y": data['cnt'],
                                'type': "bar",
                            }],
                            "layout": {"title": "Title_1"}
                        }
                    ),
                    className='card',
                ), # Graph
                html.P("--- Table ----"),
                html.Div(
                    children=dash_table.DataTable(
                        id = "data_id",
                        columns=[{"id":c, "name":c} for c in data.columns],
                        data = data.to_dict('records'),
                        export_format="xlsx",
                    ) # children
                ) # Table
            ],
            className="wrapper",
        )
    ],
)
.
.
- 이번에는 CSS 코드를 추가했다.
.
.
.
.wrapper {
    margin-right: auto;
    margin-left: auto;
    max-width: 1024px;
    padding-right: 10px;
    padding-left: 10px;
    margin-top: 32px;
}

.card {
    margin-bottom: 24px;
    box-shadow: 0 4px 6px 0 rgba(0, 0, 0, 0.18);
}
- 이제 코드를 재실행하면 아래와 같은 결괏값이 나타난다.
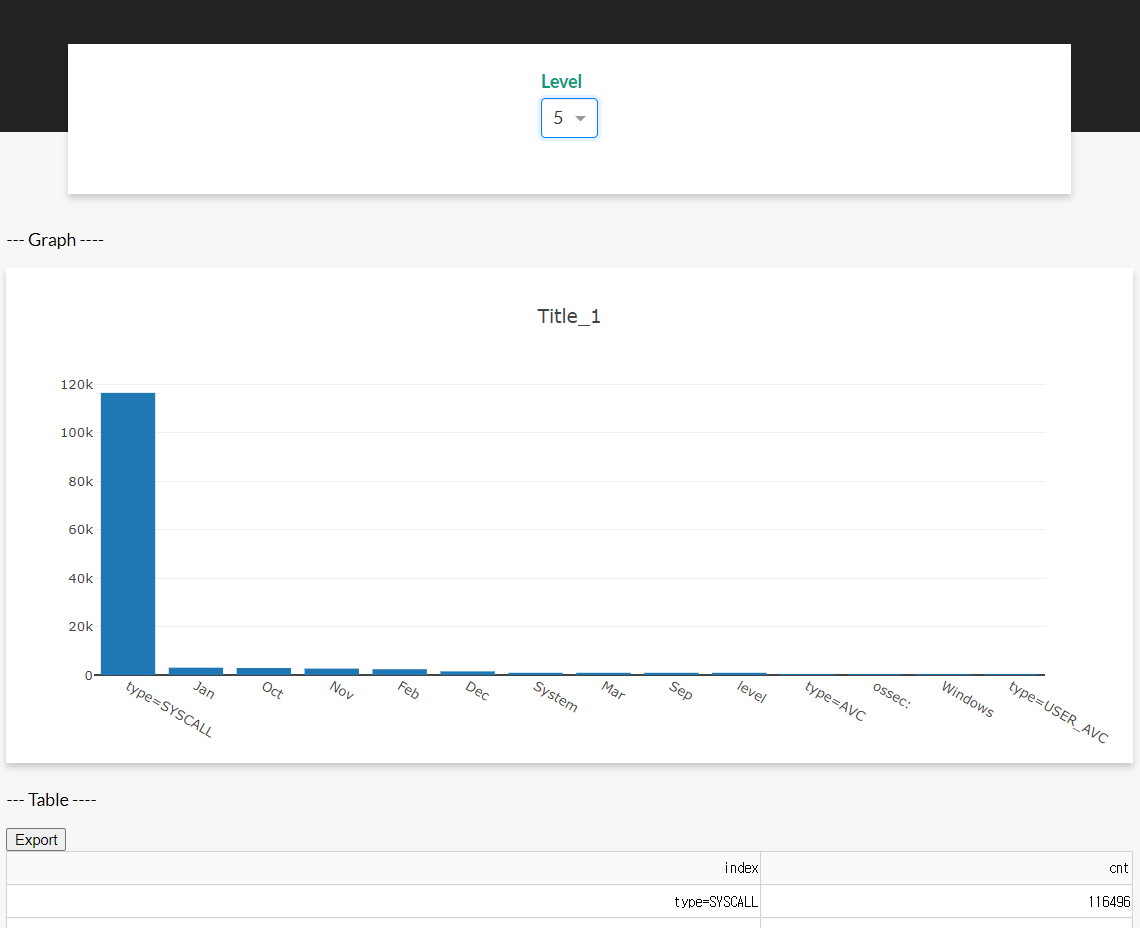
- 그러나, 레벨 5로 변경하더라도 그래프와 테이블이 변경되지는 않는다.
(6) callback 코드 작성
- 콜백에 관한 구체적인 설명은 Basic Dash Callbacks 에서 확인한다.
- 아래 코드만 추가하도록 한다.
- dash.Dash 코드를 변경한다.
- 그리고,
app.callback코드를 추가한다.
app = dash.Dash(__name__, external_stylesheets=external_stylesheets,
                suppress_callback_exceptions=True,
                prevent_initial_callbacks=True)
.
.
.
@app.callback(
    [Output("bar-chart", "figure"), Output('data_id', 'data')],
    Input("level-dropdown", "value")
)

def update_charts(value):
    data = get_df(train_df, level=value)
    bar_chart_figure = {
        "data": [
            {
                "x": data["index"],
                "y": data["cnt"],
                "type": "bar",
            },
        ],
        "layout": {"title": f'Level {value} Chart'},
    }

    return bar_chart_figure, data.to_dict('records')

.
.
if __name__ == "__main__":
    app.run_server(debug=True)
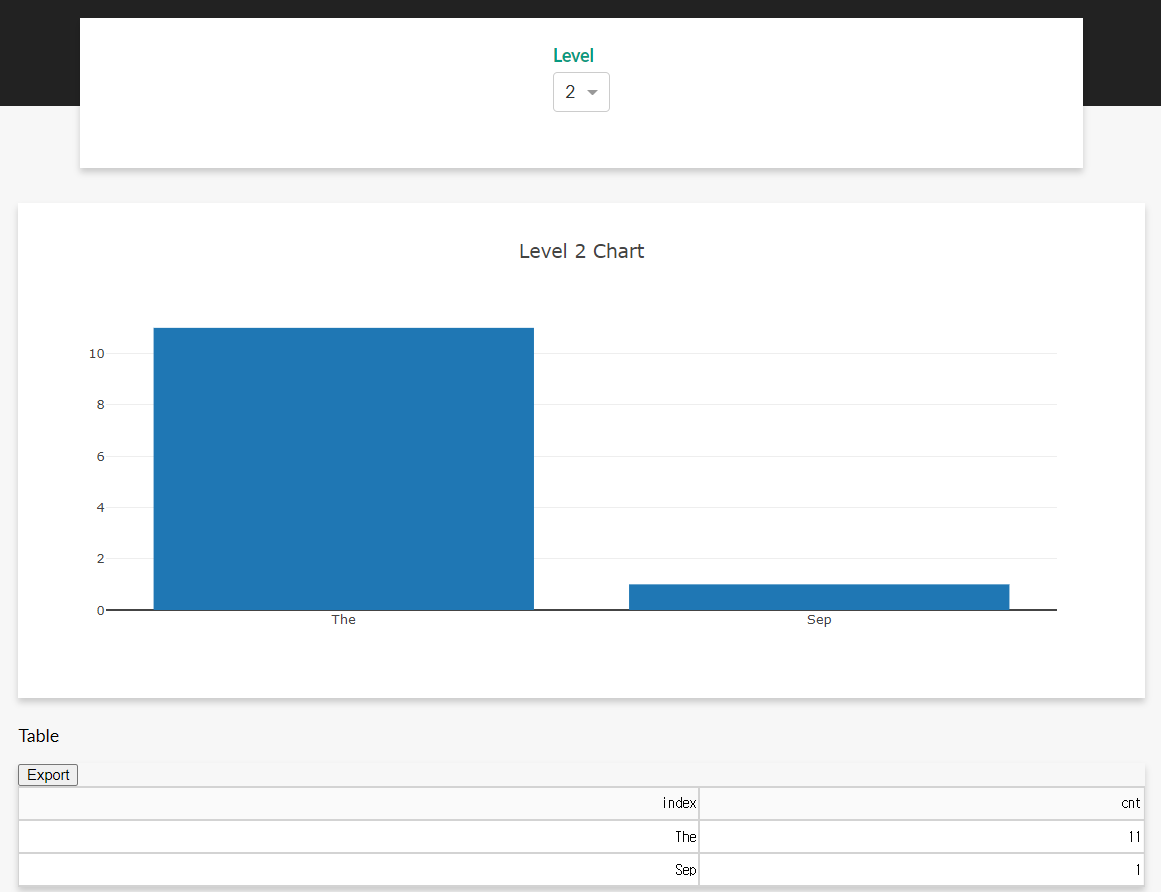
- 최종적인 화면을 확인하면 level에 따라 그래프와 테이블이 동시에 변하는 것을 확인할 수 있다.
