Python Dash를 활용한 대시보드 만들기 with Heroku
Page content
강의 소개
- 필자의 강의를 소개합니다.
개요
- 대시보드 프로젝트를 진행한다.
- Heroku에 배포까지 진행하는 것을 목적으로 한다.
- 참조: https://realpython.com/python-dash/
- 여기에 있는 내용을 최대한 간결하게 한글로 재 작성하였다. 중간에 없는 코드들도 있으니, 가급적 본 소스코드를 활용한다.
1. 데이터 수집
- 데이터: https://www.kaggle.com/neuromusic/avocado-prices
- 다운로드 받은 파일은 임의의 폴더 안에 넣습니다. (필자: dashboard-project21)
C:\Users\1\Desktop\dashboard-project21>tree /f
폴더 PATH의 목록입니다.
볼륨 일련 번호는 E657-CFA3입니다.
C:.
│  README.md
│
└─data
        avocado.csv
- 파일 경로를 주의해서 보도록 합니다.
2. 가상환경 및 라이브러리 설치
- conda를 활용하여 가상환경 설정을 합니다.
- (dashboard-project21) 형태로 터미널 명령어가 바뀌어 있어야 합니다.
$ conda create --name dashboard-project21 python=3.8
.
.
$ conda activate dashboard-project21
(dashboard-project21) C:\Users\1\Desktop\dashboard-project21>
- 이번에는
dash라이브러리를 설치한다.
$ conda install dash
$ conda install pandas
$ conda install colorama
3. 대시 보드 코드 작성
(1) 데이터 수집 및 Dash 클래스 정의
import dash
import dash_core_components as dcc
import dash_html_components as html
import pandas as pd

# step 1. Data Import
data = pd.read_csv("avocado.csv", index_col=0)
data = data.query("type == 'conventional' and region == 'Albany'")
data["Date"] = pd.to_datetime(data["Date"], format="%Y-%m-%d")
data.sort_values("Date", inplace=True)

# step 2. Dash Class
app = dash.Dash(__name__)
dash라이브러리는 대시보드 어플리케이션 초기화를 담당한다.dash_core_components동적 구성요소들(예: 그래프, 드롭다운 메뉴, 날짜 기간 등) 작성할 수 있도록 도와주는 기능을 제공한다.dash_html_components은 html 태그에 접근하도록 한다.pandas데이터 수집 및 가공을 제공할 수 있는 함수들을 지원한다.- 코드 설명
- step 1
- 데이터를 avocado.csv 데이터를 수집한 후,
type = conventional과,region = Albany만 추출하는 행을 추출한다. - 그 이후 날짜의 오름차순으로 정렬하는 코드를 작성한다.
- 데이터를 avocado.csv 데이터를 수집한 후,
- step 2
- Dash 클래스를 정의하여 app이라는 객체를 별도 생성한 것을 의미한다.
- step 1
(2) 대시보드 HTML Layout 정의
- 이전 코드에 이어서 작성을 하도록 한다.
# step 3. HTML
app.layout = html.Div(
	  # Header Message
    children=[
        html.H1(children="Temp Analytics",),
        html.P(
            children="Temp",
        ),
        # 그래프
        dcc.Graph(
            figure={
                "data": [
                    {
                        "x": data["Date"],
                        "y": data["AveragePrice"],
                        "type": "lines",
                    },
                ],
                "layout": {"title": "Title_1"},
            },
        ),
        dcc.Graph(
            figure={
                "data": [
                    {
                        "x": data["Date"],
                        "y": data["Total Volume"],
                        "type": "lines",
                    },
                ],
                "layout": {"title": "Title_2"},
            },
        ),
    ]
)
-
Dash는 크게 2가지로 구성이 된다.- Dash HTML Components : HTML components용 Wrappers를 제공합니다. 이 라이브러리를 사용하여 문단, 제목 또는 목록과 같은 요소를 작성할 수 있다.
- Dash Core Components : 대화형 사용자 인터페이스를 만들기 위한 Python 추상화를 제공합니다. 그래프, 슬라이더 또는 드롭다운과 같은 interactive elements를 만드는 데 사용할 수 있다.
-
코드를 분석하면 다음과 같다.
# Header Message:html.div는 일종의 parent component라고 볼 수 있다. 그리고, html.h1은 h1 태그를 말하며, html.p은 p 태그를 의미한다.- HTML 코드로 변환하면 아래와 같다.
<div>
  <h1>Temp Analytics</h1>
  <p>
    Temp
  </p>
  <!-- Rest of the app -->
</div>
# 그래프: 그래프가 구현되는 코드를 작성했다. dcc.Graph에 관한 설명은 다음 공식 문서에서 확인을 하도록 한다. https://dash.plotly.com/dash-core-components/graph
(3) 대시보드 배포 (localhost)
- 이전 코드에 이어서 작성을 하도록 한다.
if __name__ == "__main__":
    app.run_server(debug=True)
-
위 코드를 실행하면, Flask 기반의 서버로 작동을 한다. 파라미터
debug=True를 하게되면, 수정입력을 해도, 서버를restarting하지 않고, 새로고침으로 변화를 확인할 수 있다. -
위 모든 소스코드를
[app.py](http://app.py)에 저장 후 실행한다. -
파일의 경로는 아래와 같다.
C:\Users\1\Desktop\dashboard-project21>tree /f C:. │ app.py │ README.md │ ├─.idea │ │ .gitignore │ │ dashboard-project21.iml │ │ misc.xml │ │ modules.xml │ │ vcs.xml │ │ workspace.xml │ │ │ └─inspectionProfiles │ profiles_settings.xml │ └─data avocado.csv- 이제 app.py을 실행한다. 아래와 같이 나온다면 정상적으로 실행된 것이다.
(dashboard-project21) C:\Users\1\Desktop\dashboard-project21> python app.py Dash is running on http://127.0.0.1:8050/ * Serving Flask app "app" (lazy loading) * Environment: production WARNING: This is a development server. Do not use it in a production deployment. Use a production WSGI server instead. * Debug mode: on- 실행 취소는
ctrl + c을 하면 된다. - 인터넷에서
[http://127.0.0.1:8050/](http://127.0.0.1:8050/)을 확인하도록 한다.
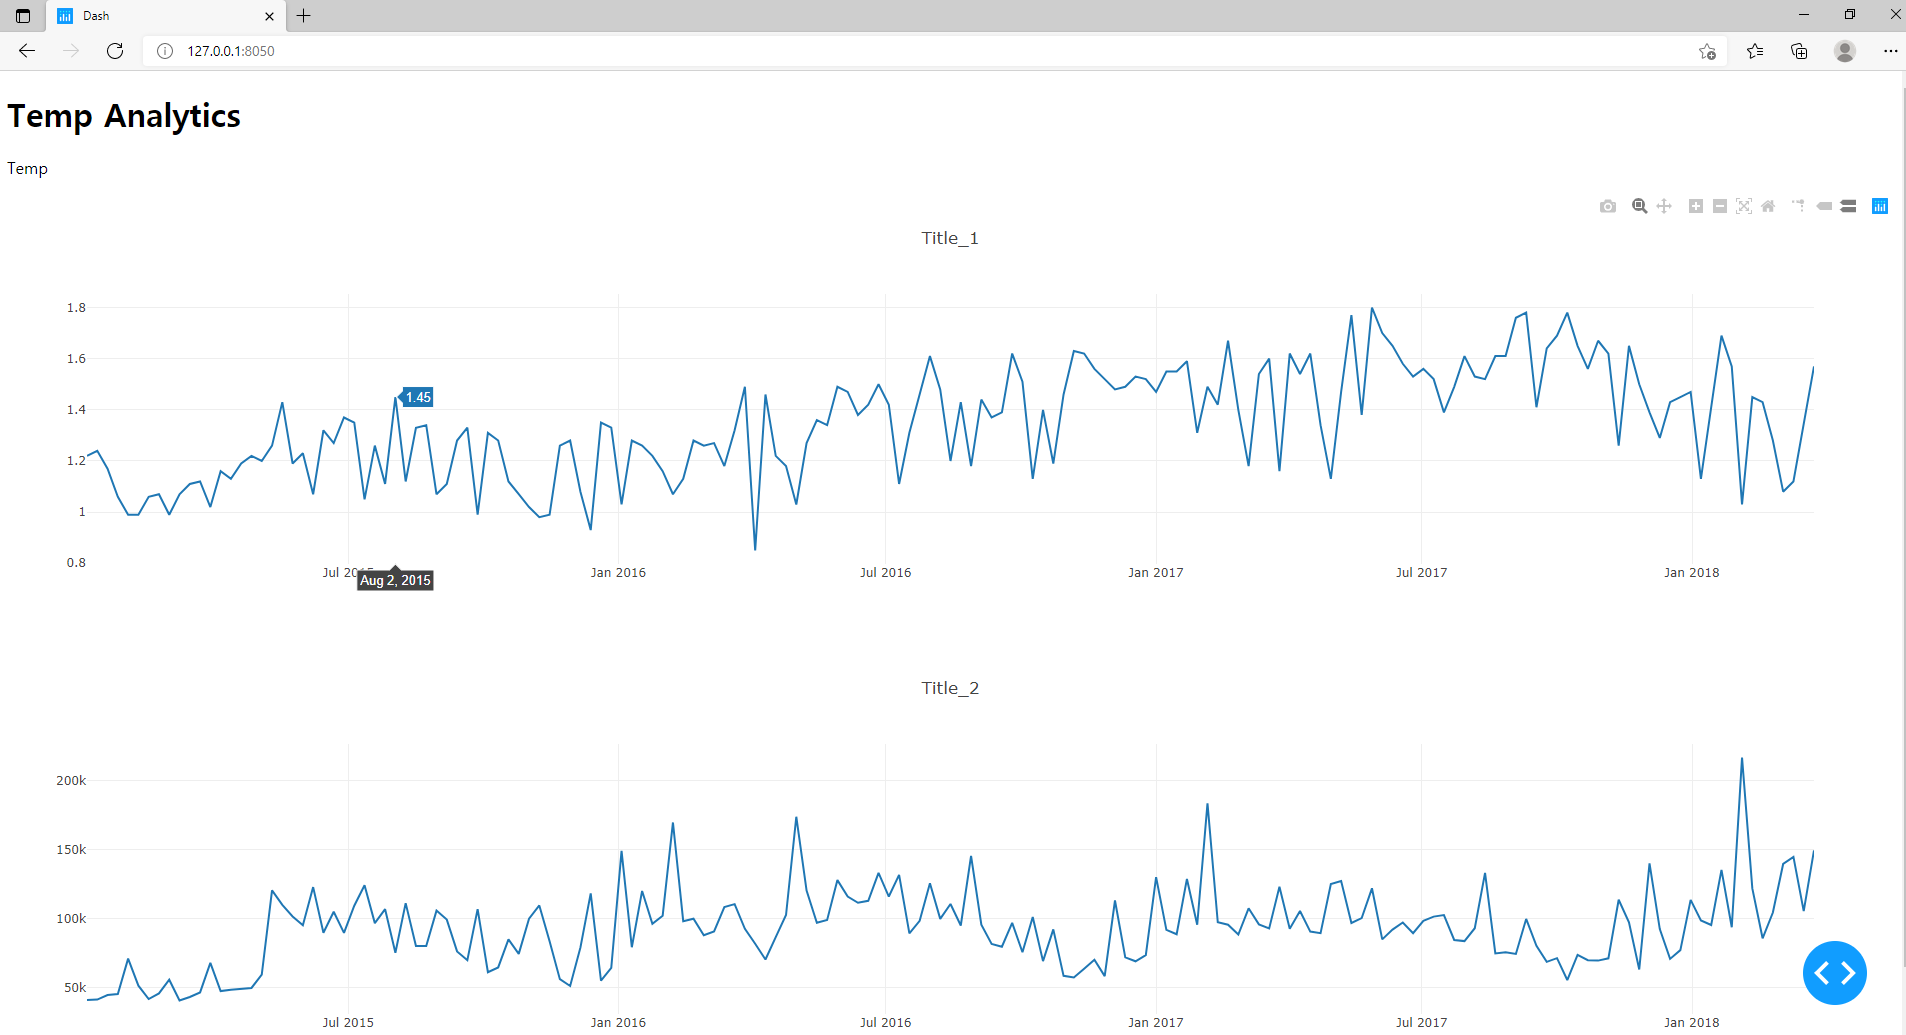
- 대시보드가 구현된 것을 확인할 수 있다.
4. 대시보드에 Style 입히기
- 기존에 작성된 것으로도 충분히 시각화는 구현할 수 있다.
- 그러나, 대시보드 개발은
CSS를 활용할 때, 보다 예쁘게 꾸밀 수 있다.
(1) 태그에 직접 style 입히기
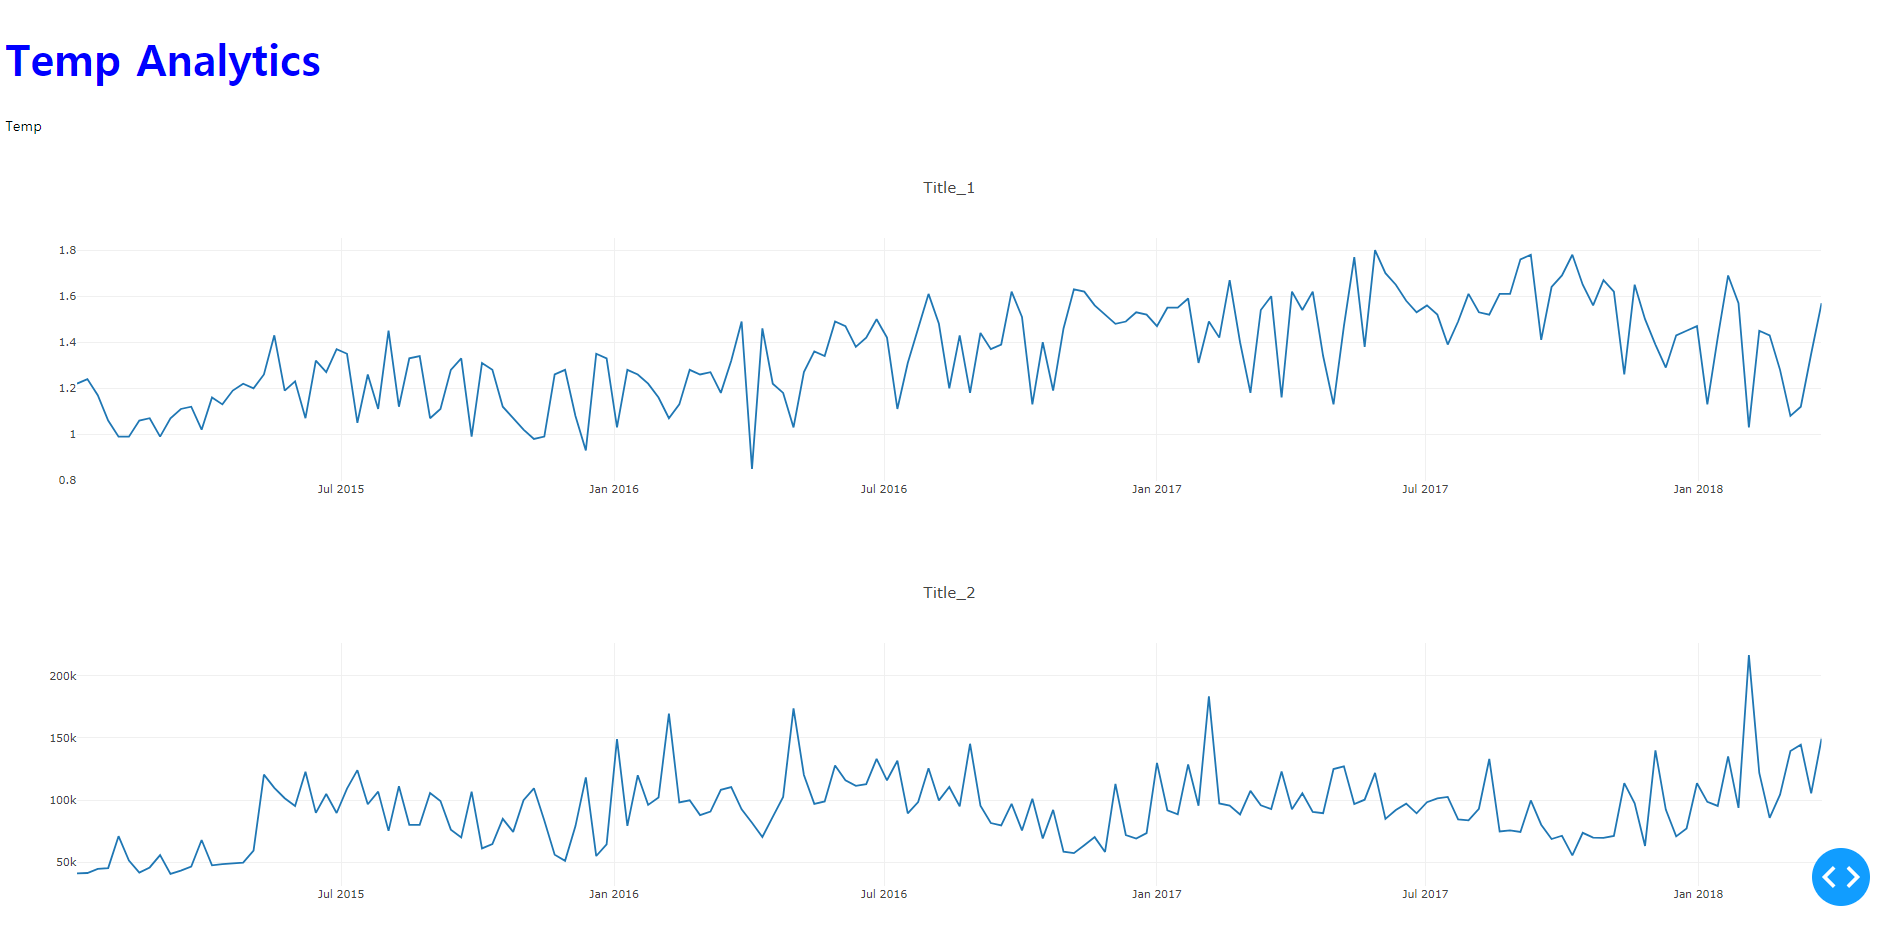
- H1 태그에 폰트 사이즈와 색상에 변화를 주도록 한다.
style={"fontSize": "48px", "color": "blue"}를 추가한다.
html.H1(
    children="Temp Analytics",
    style={"fontSize": "48px", "color": "blue"},
),
Temp Analytics가 바뀐 것을 확인할 수 있다.
-
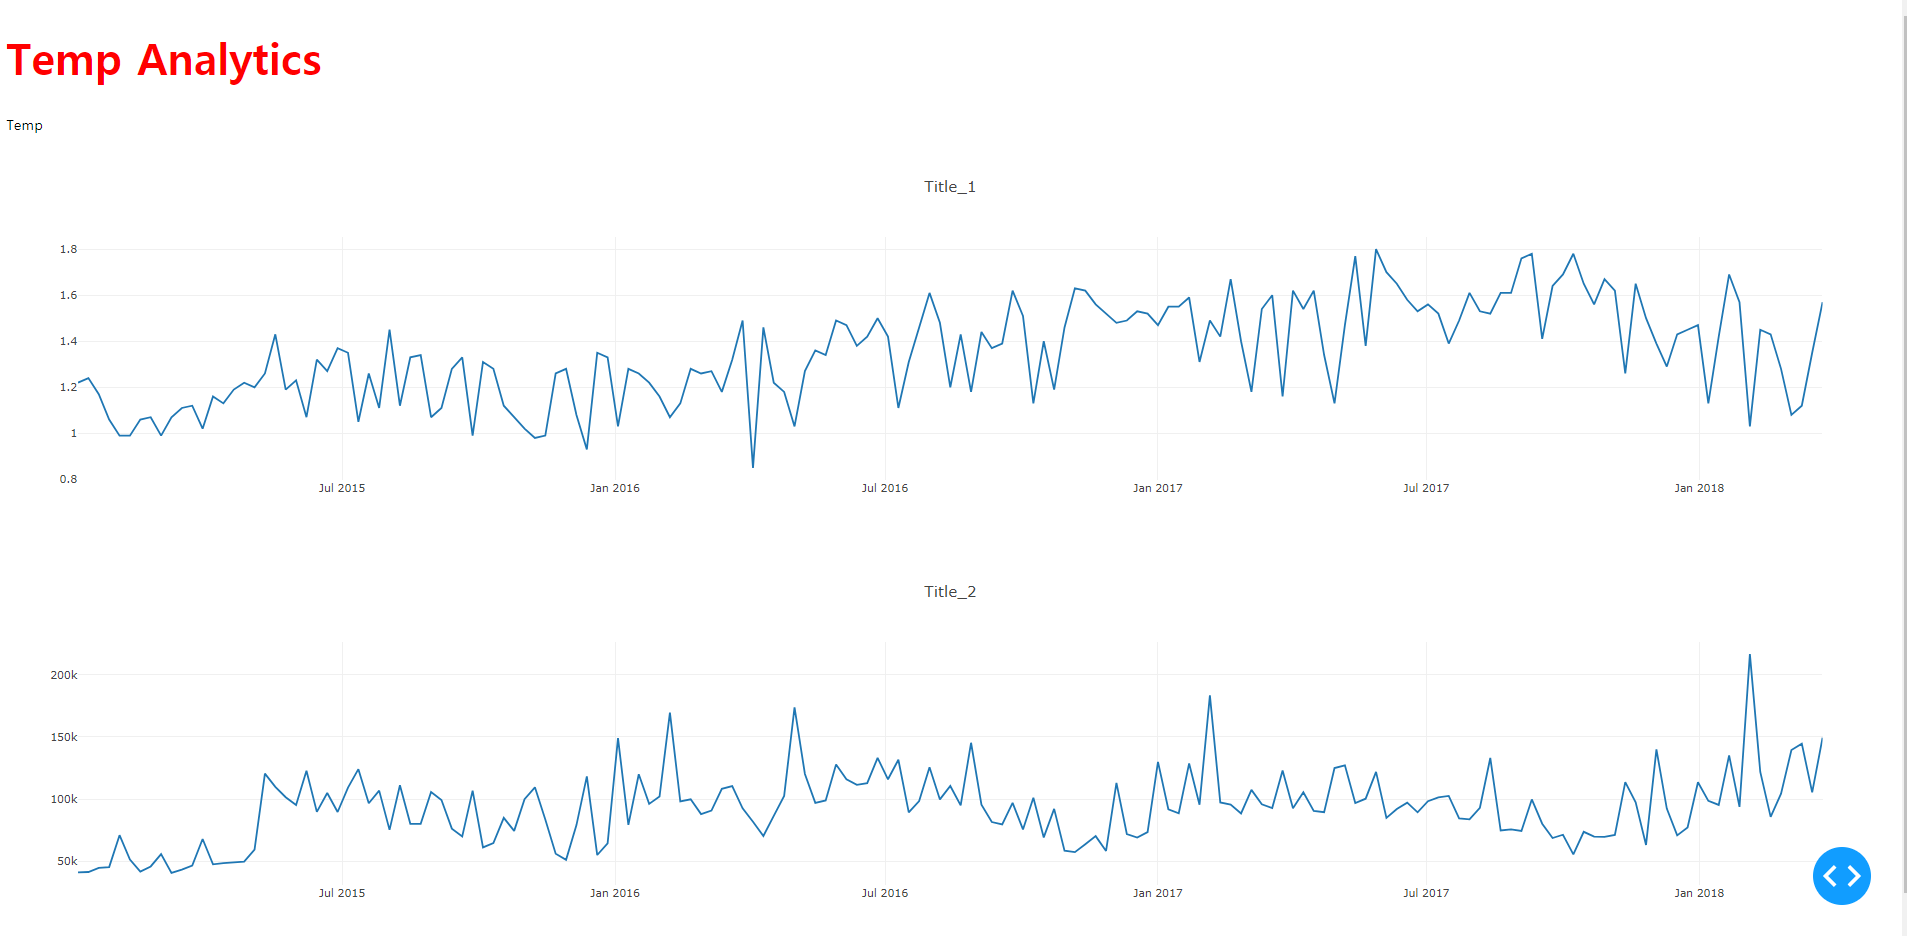
그러나, 코드 관리를 위해서는 css 파일로 관리하는 것이 적절하다.
-
따라서, 기존에 추가한
style = ~이하 코드는 삭제하고, 아래와 같이 코드를 재 작성한다.html.H1( children="Temp Analytics", className="header_title", ), -
CSS 파일을 하나 생성한 후, assets 폴더에
style.css파일을 추가적으로 생성한다.- 폴더의 구조는 아래와 같다.
(dashboard-project21) C:\Users\1\Desktop\dashboard-project21>tree /f 폴더 PATH의 목록입니다. 볼륨 일련 번호는 E657-CFA3입니다. C:. │ app.py │ README.md │ ├─.idea │ │ .gitignore │ │ dashboard-project21.iml │ │ misc.xml │ │ modules.xml │ │ vcs.xml │ │ workspace.xml │ │ │ └─inspectionProfiles │ profiles_settings.xml │ ├─assets │ style.css │ ├─data │ avocado.csv- className에 해당하는 css 코드를
style.css에 입히면 완성이다. - 이 때에는 색상의 변화를 주기 위해, blue 대신에 red 색상을 추가했다.
.header_title {
  font-size: 48px;
  color: red;
}
/img/python/dash/dash_project/
(2) 로고 추가하기
-
임의의 로고를 추가한다. 필자는 Avocado에 어울리는 과일을 하나 가져온 후, assets 폴더에 추가한다.
│ ├─assets │ favicon.ico │ style.css -
일단, 로고만 추가한 후, 코드 수정은 추후에 진행한다.
(3) External Style Sheet
- 외부에서 css 파일 등을 가져올 수 있다.
- 마지막 app.title은 구글 검색 또는 사이트 공유 시 나타나는 타이틀이다.
# step 2. Dash Class
external_stylesheets = [
    {
        "href": "https://fonts.googleapis.com/css2?"
                "family=Lato:wght@400;700&display=swap",
        "rel": "stylesheet",
    },
]
app = dash.Dash(__name__, external_stylesheets=external_stylesheets)
app.title = "Temp Analytics: Understand Your Data!"
(4) Header Layout 커스텀화
- 먼저 header 화면과 그래프 구성하는 화면을 div 태그로 구분하는 코드를 작성한다.
- 이 때 중요한 건 className을 각 태그마다 입력하는 것이다.
.
.
# step 3. HTML
app.layout = html.Div(
    children=[
        html.Div(
            children=[
                html.P(children="📈", className="header_emoji"),
                html.H1(children="Temp Analytics", className="header_title",),
                html.P(children="Temp", className="header_description",),
            ],
            className='header',
        ),
		dcc.Graph(
        figure={
            "data": [
								.
								.
- 이번에는 css파일을 아래와 같이 수정한다.
.header_emoji {
    font-size: 48px;
    margin: 0 auto;
    text-align: center;
}

.header_title {
    color: #FFFFFF;
    font-size: 48px;
    font-weight: bold;
    text-align: center;
    margin: 0 auto;
}

.header_description {
    color: #CFCFCF;
    margin: 4px auto;
    text-align: center;
    max-width: 384px;
}

.header {
    background-color: #222222;
    height: 256px;
    display: flex;
    flex-direction: column;
    justify-content: center;
}
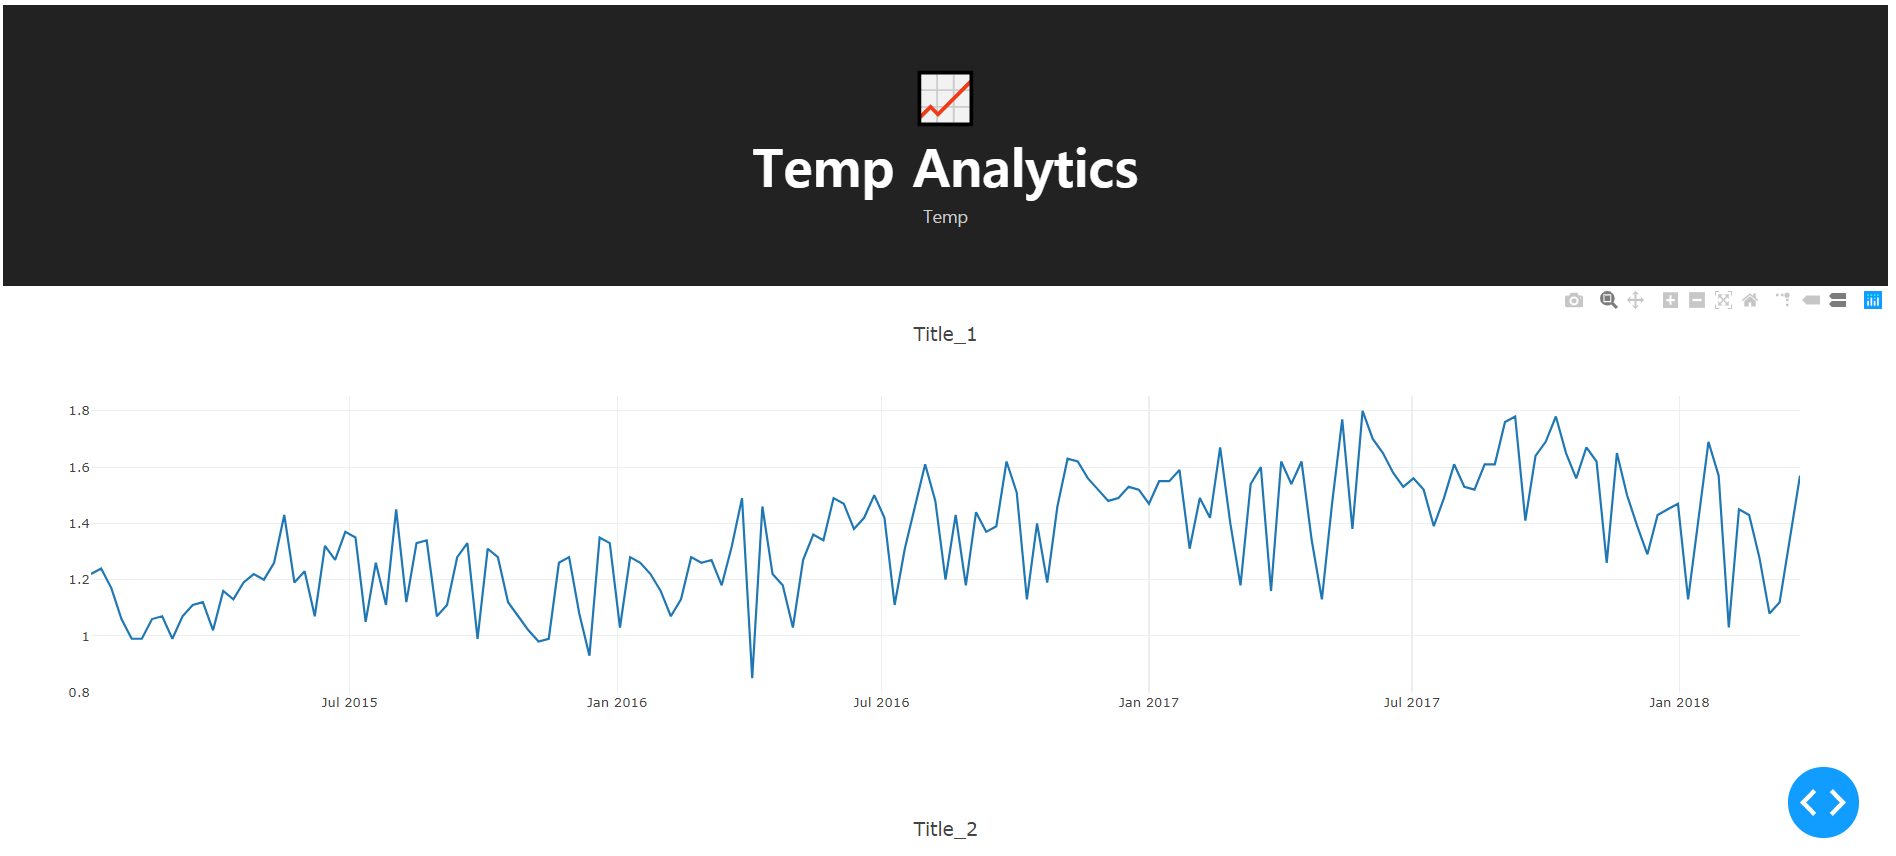
- 이제 결과물을 확인한다.
(5) 그래프 Layout 커스텀화
- 동일한 방식으로 그래프를 커스텀화 하는 코드를 작성한다.
.
.
.
# step 3. HTML
app.layout = html.Div(
    children=[
        html.Div(
            children=[
                html.P(children="📈", className="header_emoji"),
                html.H1(children="Temp Analytics", className="header_title",),
                html.P(children="Temp", className="header_description",),
            ],
            className='header',
        ),
        html.Div(
            children=[
                html.Div(
                    children=dcc.Graph(
                        id="price-chart",
                        config={"displayModeBar": False},
                        figure={
                            "data": [
                                {
                                    "x": data["Date"],
                                    "y": data["AveragePrice"],
                                    "type": "lines",
                                    "hovertemplate": "$%{y:.2f}"
                                    "<extra></extra>",
                                },
                            ],
                            "layout": {
                                "title": {
                                    "text": "아보카도 평균가격($)",
                                    "x": 0.05,
                                    "xanchor": "center",
                                },
                                "xaxis": {"fixedrange": True},
                                "yaxis": {
                                    "tickprefix": "$",
                                    "fixedrange": True,
                                },
                                "colorway": ["#17B897"],
                            },
                        },
                    ),
                    className="card",
                ),
                html.Div(
                    children=dcc.Graph(
                        id="volume-chart",
                        config={"displayModeBar": False},
                        figure={
                            "data": [
                                {
                                    "x": data["Date"],
                                    "y": data["Total Volume"],
                                    "type": "lines",
                                },
                            ],
                            "layout": {
                                "title": {
                                    "text": "아보카도 판매량",
                                    "x": 0.05,
                                    "xanchor": "center",
                                },
                                "xaxis": {"fixedrange": True},
                                "yaxis": {"fixedrange": True},
                                "colorway": ["#E12D39"],
                            },
                        },
                    ),
                    className="card",
                ),
            ],
            className="wrapper",
        ),
    ]
)
- 먼저,
"hovertemplate": "$%{y:.2f}" "<extra></extra>",는 마우스를 그래프에 갔다 대면,$표시가 나타나는 옵션이다. - 전체적인 그래프에 대한 코드는
card클래스로 정의했다. 그리고, div 영역은wrapper로 구성했다. - 이번에는
card와wrapper를 정의하는css코드를 추가한다.
.
.
.wrapper {
    margin-right: auto;
    margin-left: auto;
    max-width: 1024px;
    padding-right: 10px;
    padding-left: 10px;
    margin-top: 32px;
}

.card {
    margin-bottom: 24px;
    box-shadow: 0 4px 6px 0 rgba(0, 0, 0, 0.18);
}
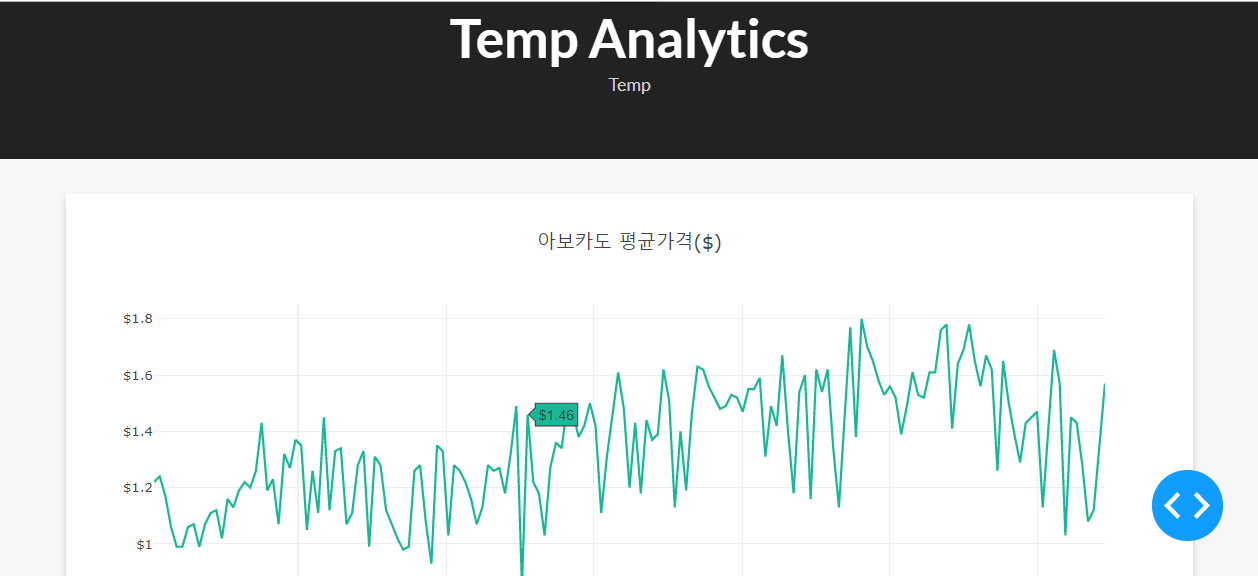
- 파이썬과 CSS에서 추가된 코드를 통해 다음과 같은 결과물을 확인할 수 있다.
5. 대시보드에 Interactive 구현하기
- 날짜를 지정하여 그래프를 작성할 수는 없을까?
- 지역을 선택할 때마다, 라인 그래프가 변동시킬 수는 없을까?
- 위와 같은 질문에 대답하기 위해서는 Interactive Component를 구성해야 한다.
(1) 메뉴 구성하기
- 데이터부터 확인해본다.
import pandas as pd

# step 1. Data Import
data = pd.read_csv("data/avocado.csv", index_col=0)
data = data.query("type == 'conventional' and region == 'Albany'")
data["Date"] = pd.to_datetime(data["Date"], format="%Y-%m-%d")
data.sort_values("Date", inplace=True)
print(data.info())
<class 'pandas.core.frame.DataFrame'>
Int64Index: 169 entries, 51 to 0
Data columns (total 13 columns):
 #   Column        Non-Null Count  Dtype
---  ------        --------------  -----
 0   Date          169 non-null    datetime64[ns]
 1   AveragePrice  169 non-null    float64
 2   Total Volume  169 non-null    float64
 3   4046          169 non-null    float64
 4   4225          169 non-null    float64
 5   4770          169 non-null    float64
 6   Total Bags    169 non-null    float64
 7   Small Bags    169 non-null    float64
 8   Large Bags    169 non-null    float64
 9   XLarge Bags   169 non-null    float64
 10  type          169 non-null    object
 11  year          169 non-null    int64
 12  region        169 non-null    object
dtypes: datetime64[ns](1), float64(9), int64(1), object(2)
memory usage: 18.5+ KB
None
- 여기에서 3가지 컬럼을 메뉴로 활용한다.
- Region
- Type of avocado
- Date range
- 기존 코드에서 중간 코드만 주석 처리하면, 각각의 type, region 등을 확인할 수 있다.
data = pd.read_csv("data/avocado.csv", index_col=0)
# data = data.query("type == 'conventional' and region == 'Albany'")
data["Date"] = pd.to_datetime(data["Date"], format="%Y-%m-%d")
data.sort_values("Date", inplace=True)

# print(data.info())
print(data[['region', 'type', 'Date']].head())

                region          type       Date
51           Southeast       organic 2015-01-04
51             Chicago       organic 2015-01-04
51  HarrisburgScranton       organic 2015-01-04
51          Pittsburgh  conventional 2015-01-04
51               Boise       organic 2015-01-04
- 위 3가지 메뉴가 구성되도록
html.Div를 추가하는 코드를 작성한다.- 드롭다운 관련 함수 설명: https://dash.plotly.com/dash-core-components
- 날짜 관련 함수 설명: https://dash.plotly.com/dash-core-components/datepickerrange
.
.
import numpy as np
.
.
# step 3. HTML
app.layout = html.Div(
    children=[
        html.Div(
            children=[
                html.P(children="📈", className="header_emoji"),
                html.H1(children="Temp Analytics", className="header_title",),
                html.P(children="Temp", className="header_description",),
            ],
            className='header',
        ),
        html.Div(
            children=[
                html.Div(
                    children=[
                        html.Div(children="Region", className="menu-title"),
                        dcc.Dropdown(
                            id="region-filter",
                            options=[
                                {"label": region, "value": region}
                                for region in np.sort(data.region.unique())
                            ],
                            value="Albany",
                            clearable=False,
                            className="dropdown",
                        ),
                    ]
                ),
                html.Div(
                    children=[
                        html.Div(children="Type", className="menu-title"),
                        dcc.Dropdown(
                            id="type-filter",
                            options=[
                                {"label": avocado_type, "value": avocado_type}
                                for avocado_type in data.type.unique()
                            ],
                            value="organic",
                            clearable=False,
                            searchable=False,
                            className="dropdown",
                        ),
                    ],
                ),
                html.Div(
                    children=[
                        html.Div(
                            children="Date Range",
                            className="menu-title"
                            ),
                        dcc.DatePickerRange(
                            id="date-range",
                            min_date_allowed=data.Date.min().date(),
                            max_date_allowed=data.Date.max().date(),
														initial_visible_month=data.Date.min().date(),
                            start_date=data.Date.min().date(),
                            end_date=data.Date.max().date(),
                        ),
                    ]
                ),
            ],
            className="menu",
        ),
        html.Div(
            children=[
                html.Div(
                    children=dcc.Graph(
                        id="price-chart",
                        config={"displayModeBar": False},
                        figure={
                            "data": [
                                {
                                    "x": data["Date"],
                                    "y": data["AveragePrice"],
                                    "type": "lines",
                                    "hovertemplate": "$%{y:.2f}"
                                    "<extra></extra>",
                                },
                            ],
                            "layout": {
                                "title": {
                                    "text": "아보카도 평균가격($)",
                                    "x": 2,
                                    "xanchor": "center",
                                },
                                "xaxis": {"fixedrange": True},
                                "yaxis": {
                                    "tickprefix": "$",
                                    "fixedrange": True,
                                },
                                "colorway": ["#17B897"],
                            },
                        },
                    ),
                    className="card",
                ),
                html.Div(
                    children=dcc.Graph(
                        id="volume-chart",
                        config={"displayModeBar": False},
                        figure={
                            "data": [
                                {
                                    "x": data["Date"],
                                    "y": data["Total Volume"],
                                    "type": "lines",
                                },
                            ],
                            "layout": {
                                "title": {
                                    "text": "아보카도 판매량",
                                    "x": 0.05,
                                    "xanchor": "left",
                                },
                                "xaxis": {"fixedrange": True},
                                "yaxis": {"fixedrange": True},
                                "colorway": ["#E12D39"],
                            },
                        },
                    ),
                    className="card",
                ),
            ],
            className="wrapper",
        ),
    ]
)

if __name__ == "__main__":
    app.run_server(debug=True)
- style.css 파일도 변경해야 한다. 아래 코드를 추가한다.
.
.
.
.menu {
    height: 112px;
    max-width: 1024px;
    display: flex;
    justify-content: space-evenly;
    padding-top: 32px;
    margin: 0px auto 0 auto;
    background-color: #FFFFFF;
    box-shadow: 0 4px 6px 0 rgba(0, 0, 0, 0.18);
}

.menu-title {
    margin-bottom: 6px;
    font-weight: bold;
    color: #079A82;
}

.Select-control {
    width: 256px;
    height: 48px;
}

.Select--single > .Select-control .Select-value, .Select-placeholder {
    line-height: 48px;
}

.Select--multi .Select-value-label {
    line-height: 32px;
}
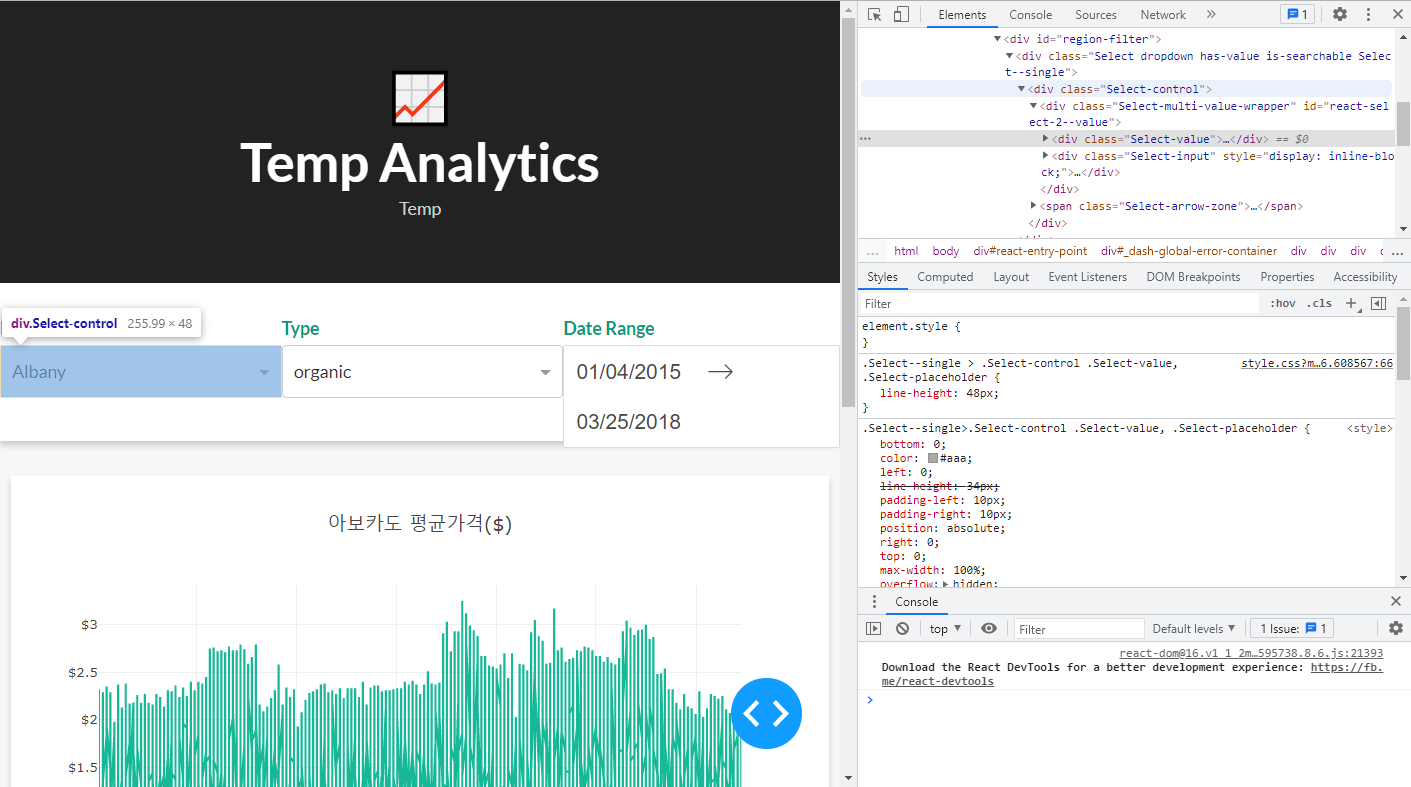
.Select-control등의 CSS 클래스명은 다음개발자 도구에서 확인하면 된다.
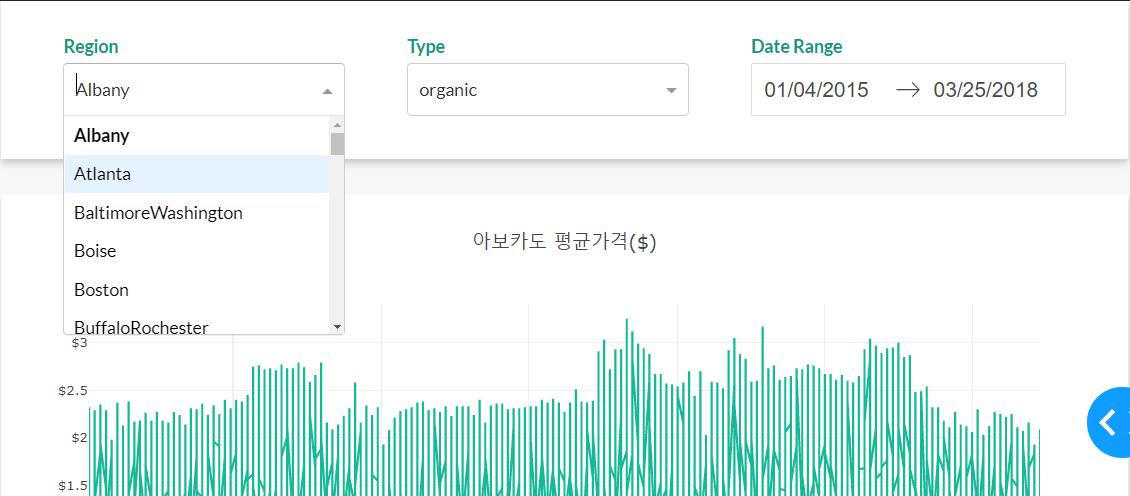
- 이 때, 화면을 보면, 아래와 같이 나올 것이다.
- 메뉴는 정상적으로 나오지만, Line 그래프는 정상적으로 나타나지 않는 것을 확인할 수 있다.
- 여기부터가 Reactive Programming이 필요한 순간이다.
dcc.Dropdowncomponent에 대한 코드 설명이 필요할 것 같다. 코드를 다시 보자.
html.Div(
    children=[
        html.Div(children="Region", className="menu-title"),
        dcc.Dropdown(
            id="region-filter",
            options=[
                {"label": region, "value": region}
                for region in np.sort(data.region.unique())
            ],
            value="Albany",
            clearable=False,
            className="dropdown",
        ),
    ]
),
- id: Dropdown 메뉴의 ID를 구성한다. 해당 ID는 향후 Callback을 정의할 때, 같이 활용된다.
- optinos: Dropdown 메뉴가 최초 선택이 될 때, 값(labesl 또는 values)을 보여줍니다.
- value: Default된 값을 보여줍니다.
- className: style.css 이 적용되는 영역이다.
(2) Reactive Programming
- 간단히 말하면, 실시간으로 반응을 하는 프로그래밍을 말한다.
- 다른 유저가 페이스북에 ‘좋아요’ 버튼을 누르면 해당 포스트를 보고 있는 사용자는 새로고침 할 것 없이 실시간으로 ‘좋아요’의 개수가 올라가는 것을 말한다.
- 프로그래밍으로는 비동기 이벤트를 처리한다고 말한다.
(3) Callbacks
- Reactive Programming의 핵심이자, 본 Tutorial의 핵심이다.
- Callback 함수란, 개발자는 이벤트를 등록하기만 할 뿐, 실제 사이트 방문자가 특정 이벤트를 발생시키면, 특정 시점에 도달했을 때 해당 기능을 활성화 시키는 것이다.

- 이제 위 코드를 실행시키는 코드를 추가한다.
- 먼저 라이브러리를 추가한다. 그리고 이전 코드에 이어서 아래 코드를 추가한다.
.
.
from dash.dependencies import Output, Input
.
.
.
@app.callback(
    [Output("price-chart", "figure"), Output("volume-chart", "figure")],
    [
        Input("region-filter", "value"),
        Input("type-filter", "value"),
        Input("date-range", "start_date"),
        Input("date-range", "end_date"),
    ],
)
def update_charts(region, avocado_type, start_date, end_date):
    mask = (
        (data.region == region)
        & (data.type == avocado_type)
        & (data.Date >= start_date)
        & (data.Date <= end_date)
    )
    filtered_data = data.loc[mask, :]
    price_chart_figure = {
        "data": [
            {
                "x": filtered_data["Date"],
                "y": filtered_data["AveragePrice"],
                "type": "lines",
                "hovertemplate": "$%{y:.2f}<extra></extra>",
            },
        ],
        "layout": {
            "title": {
                "text": "Average Price of Avocados",
                "x": 0.05,
                "xanchor": "left",
            },
            "xaxis": {"fixedrange": True},
            "yaxis": {"tickprefix": "$", "fixedrange": True},
            "colorway": ["#17B897"],
        },
    }

    volume_chart_figure = {
        "data": [
            {
                "x": filtered_data["Date"],
                "y": filtered_data["Total Volume"],
                "type": "lines",
            },
        ],
        "layout": {
            "title": {
                "text": "Avocados Sold",
                "x": 0.05,
                "xanchor": "left"
            },
            "xaxis": {"fixedrange": True},
            "yaxis": {"fixedrange": True},
            "colorway": ["#E12D39"],
        },
    }
    return price_chart_figure, volume_chart_figure
- 먼저
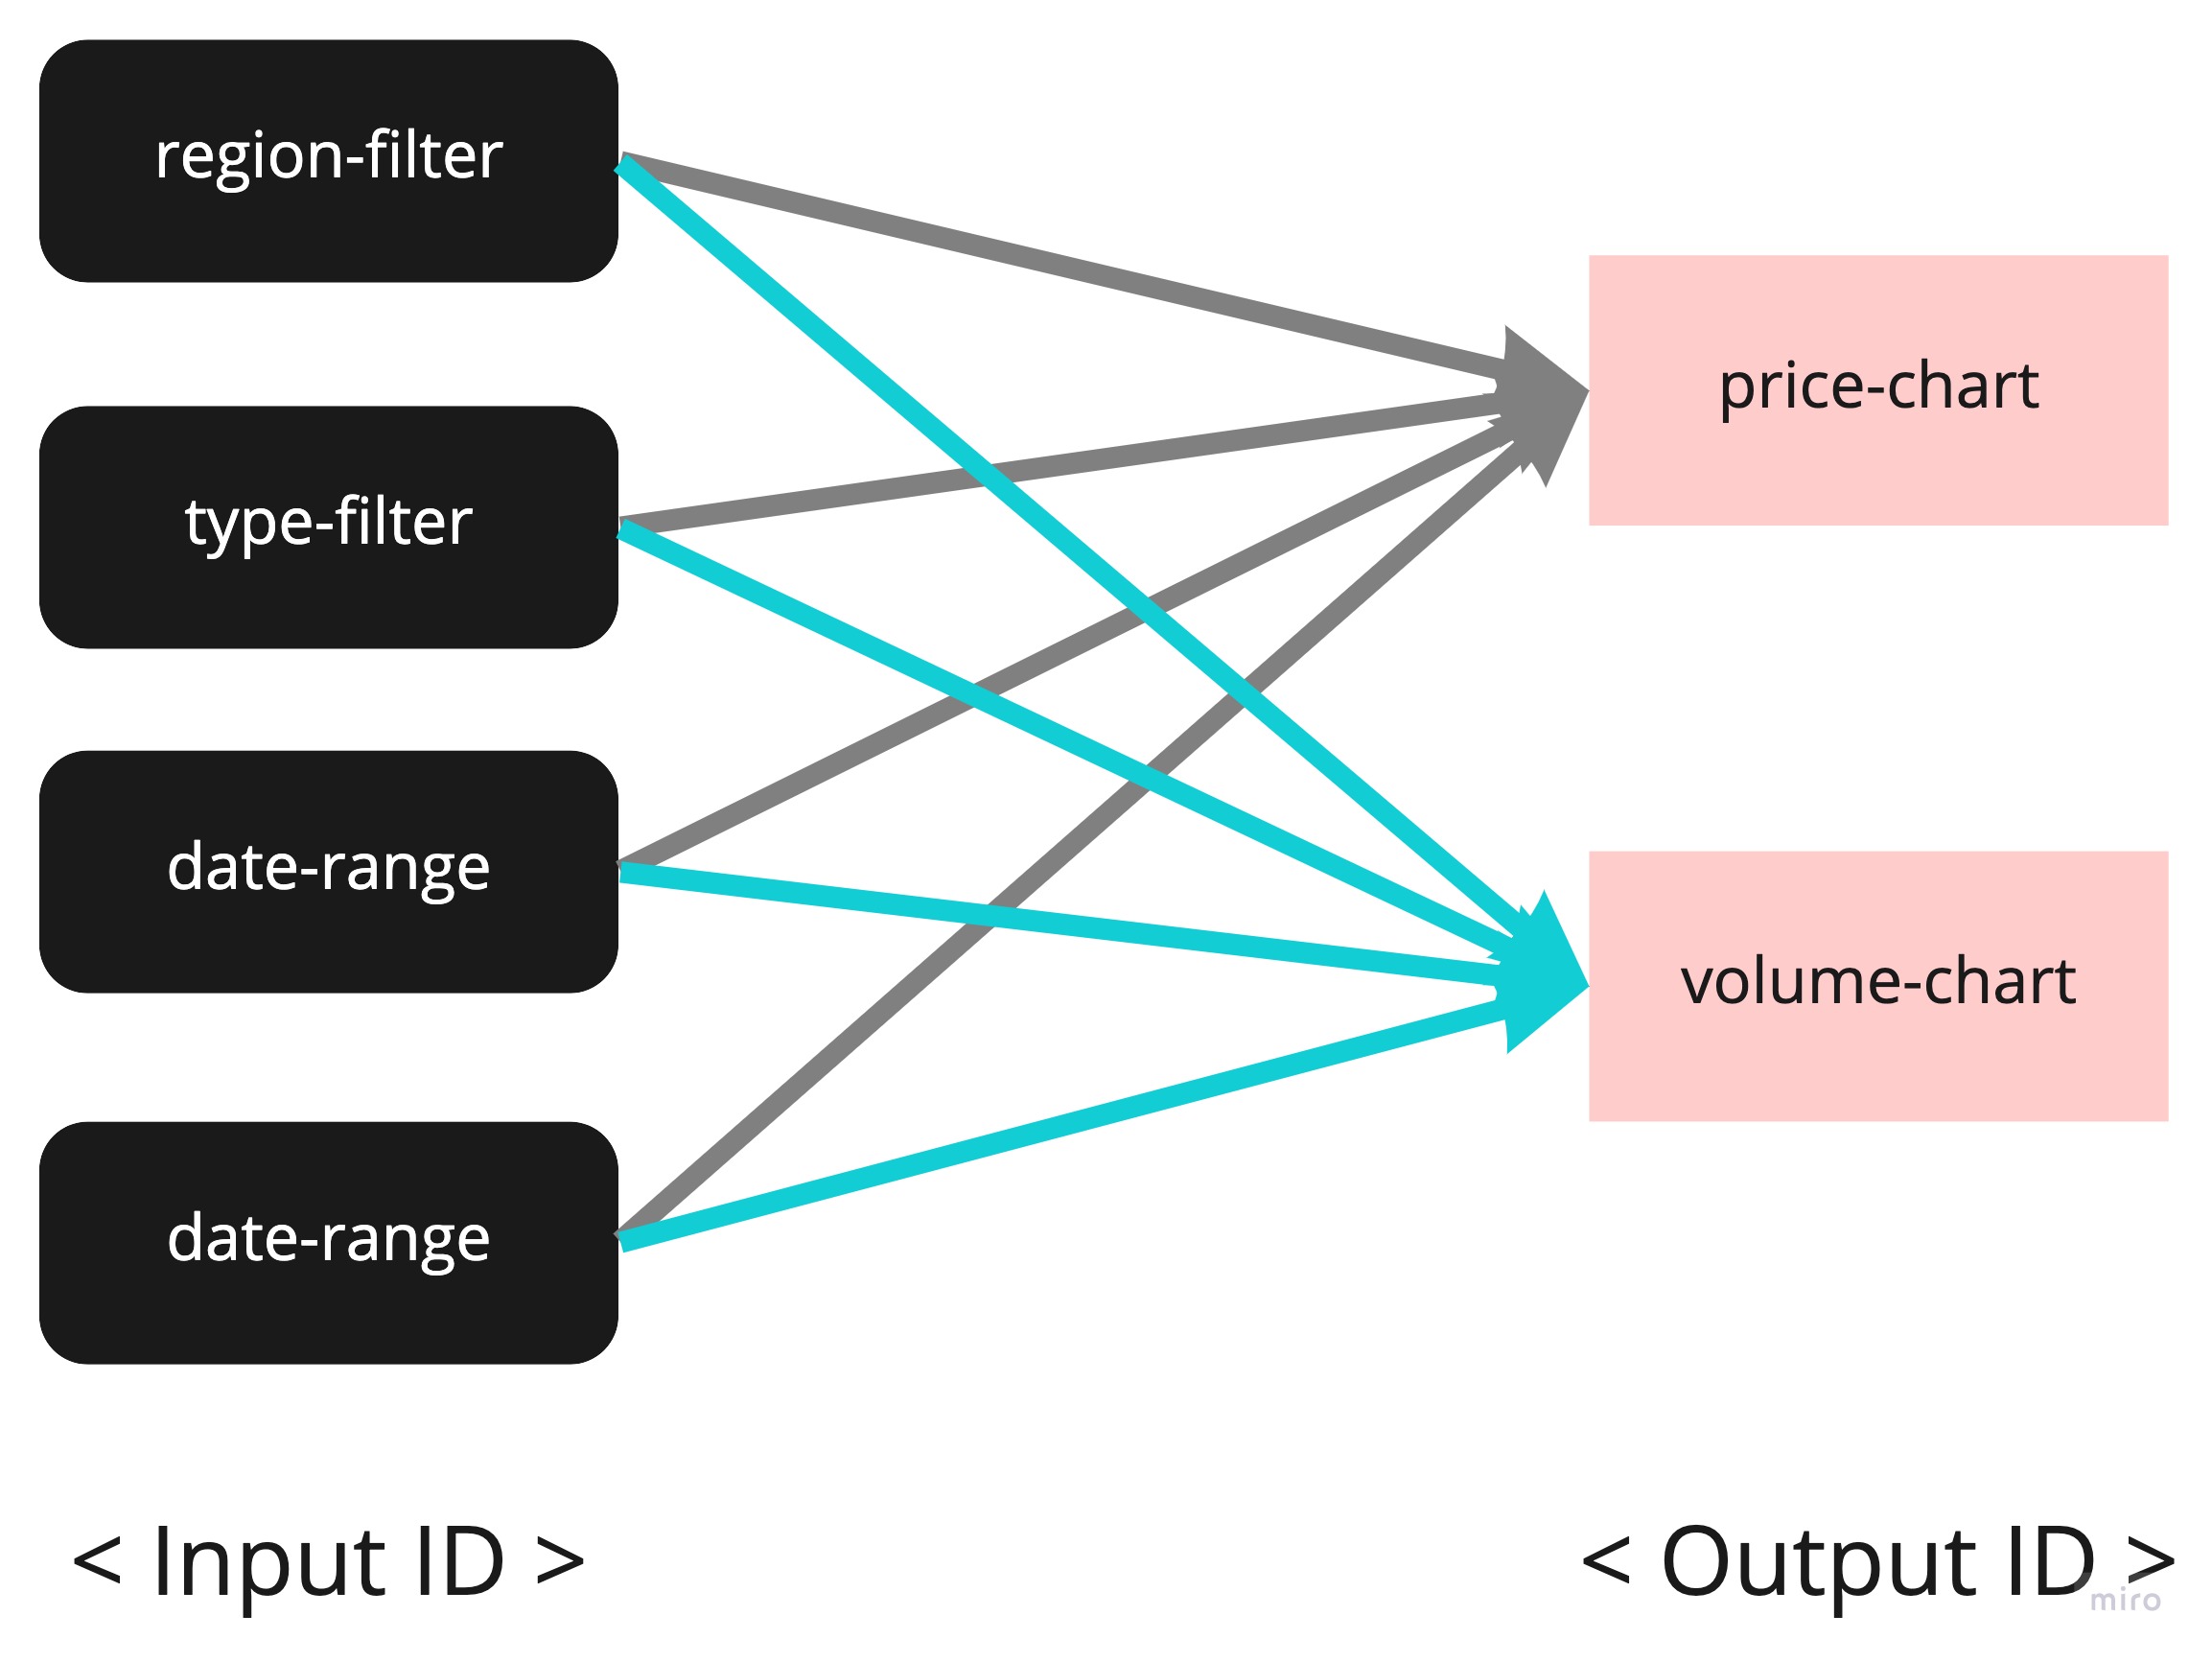
@app.callback()은 Decorator에 관한 구문이다. - 전체적인 흐름도는 Input과 Output으로 구성되어 있고, 각 ID 이름 값으로 연결이 되는 것을 확인할 수 있다.
- 새롭게 정의된 함수
update_chart는 기존에 정적으로 작성된 두개의 chart 코드를 같이 변환할 수 있도록 담아두었다.[ Input("region-filter", "value"), Input("type-filter", "value"), Input("date-range", "start_date"), Input("date-range", "end_date"), ],사용자가 각 구성요소를 선택하면, 정의된 변수value,start_date등 형태로 저장이 된다.- 각각의 값은
html.div코드에서options에 보면, 각각의 값과 연결이 되며, 최종적인 output은 반복문을 통해 구현되었다.
- 각각의 값은
[Output("price-chart", "figure"), Output("volume-chart", "figure")],에서 price-chart와 volume-chart는dcc.graphID를 의미하고,figure는 그래프에 들어가는 각각의 변환되는 데이터를 의미한다.
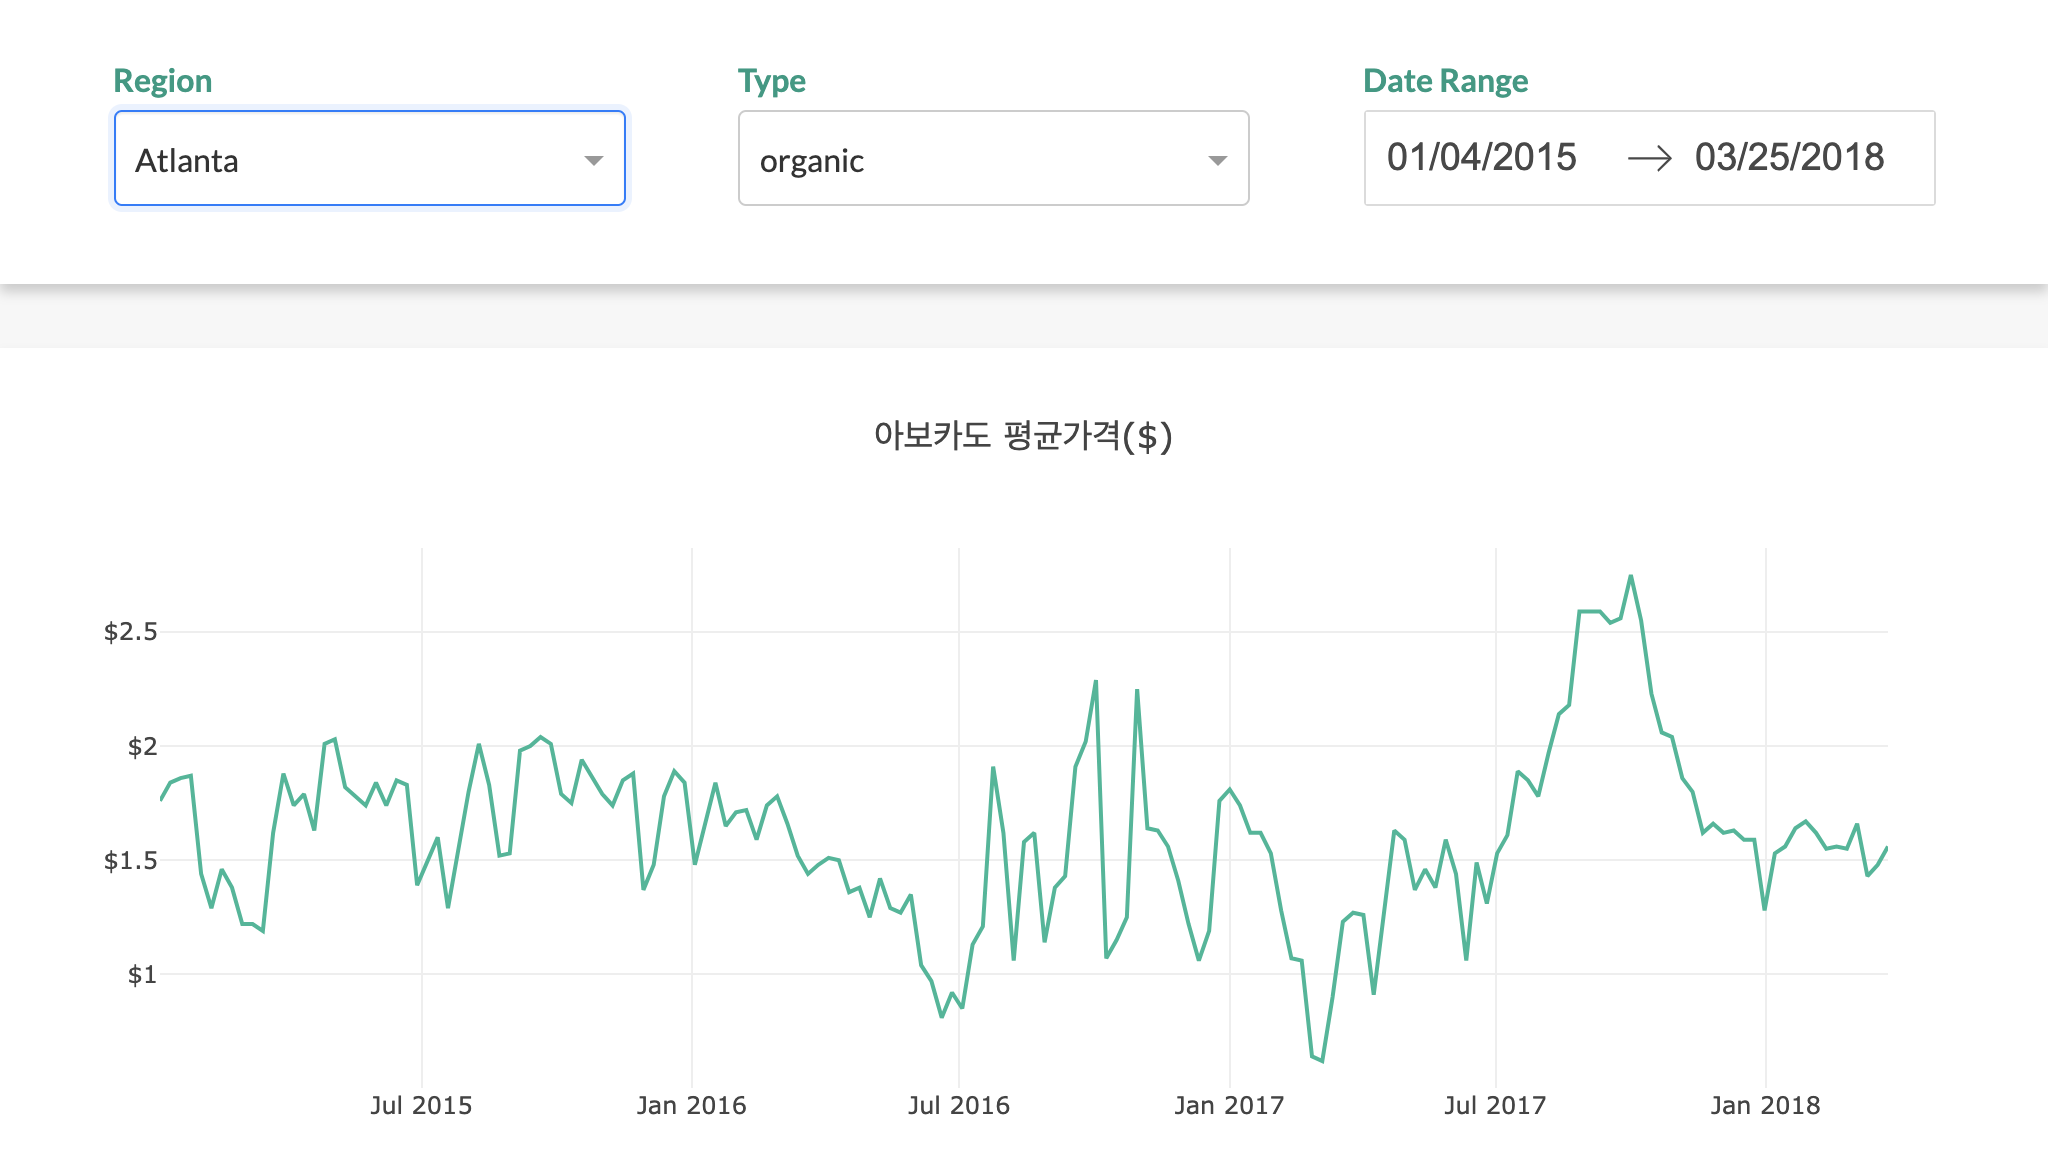
(4) 최종확인
- 이제 완성된 그래프를 확인해본다.
6. 웹 배포하기 with Heroku & Git
- 웹 배포를 위해서는 Heroku & Git 설치를 해야 한다.
- 각 버전에 맞는 것을 설치 진행한다.
Heroku&git정상적으로 설치 후 버전 확인을 화면 다음과 같이 확인이 가능하다.
(venv) $ echo 'export PATH="/usr/local/homebrew/opt/heroku-node/bin:$PATH"' >> /Users/evan/.bash_profile
(venv) $ git --version
git version 2.30.0
(venv) $ heroku --version
 ›   Warning: Our terms of service have changed: https://dashboard.heroku.com/terms-of-service
heroku/7.56.1 darwin-x64 node-v12.21.0
- app server 객체를 생성한다.
- 해당 코드는
[WSGI server](https://www.python.org/dev/peps/pep-3333/)에서 앱을 실행한다는 뜻을 가지고 있다.
- 해당 코드는
.
.
app = dash.Dash(__name__, external_stylesheets=external_stylesheets)
app.title = "Temp Analytics: Understand Your Data!"
server = app.server # 해당 코드를 새롭게 추가한다.
.
.
- 이번에는
runtime.txt파일을 프로젝트 폴더 내 상단 위치에 생성한 후, 다음과 같이 입력한다.- 해당 버전은 독자의 버전과 다를 수 있으니 확인 후 입력한다.
python-3.8.7
- 이번에는
requirements.txt라이브러리명과 각 버전을 입력하도록 한다. - 현재 virtualenv 환경에서 작업중인 것을 그대로 받으려면 다음과 같이 실행한다.
- 그러나, 기존에 설치된 라이브러리가 많으면 직접 주요 패키지만 별도로 정리하는 것을 추천한다.
$ pip freeze > requirements.txt
- 필자는 아래와 같이 추가했다.
colorama==0.4.4
dash==1.21.0
gunicorn==20.1.0
numpy==1.19.4
pandas==1.2.0
- 이번에는
Procfile을 생성한 후, 아래 텍스트를 추가한다.- Heroku app에서 gunicorn 서버로 대시보드를 운영한다는 뜻이다.
web: gunicorn app:server
- 이번에는
.gitignore파일을 생성하여 불필요한 파일들을 추적하지 않도록 한다.- 해당 파일만
git commit을 진행한다.
- 해당 파일만
venv
*.pyc
.DS_Store # 맥 사용자만 추가
- 전체적인 프로젝트의 파일 구조는 아래와 같다.
dashboard_project/
│
├── assets/
│   ├── favicon.ico
│   └── style.css
│
├── venv/
│
├── app.py
├── data/
│   ├── avocado.csv
├── Procfile
├── requirements.txt
└── runtime.txt
- 이제 마지막으로
heroku에 앱 배포를 시작한다.- 사전에 회원가입 등 진행이 되어 있어야 한다.
- 이 때, 중요한 것은 프로젝트 폴더명과 Heroku App 이름이 동일해야 한다.
dash-project21
$ heroku create dash-project21 # 각자의 이름을 추가한다.
- 이제
heroku login을 진행한다.
$ (venv) heroku login
heroku: Press any key to open up the browser to login or q to exit:
Opening browser to https://cli-auth.heroku.com/auth/cli/browser/9320abcd-b8c6-406d-9198-ca14d1e59a26?requestor=SFMyNTY.g2gDbQAAAA4yMjEuMTU3LjM3LjIxNm4GAGgtTBB7AWIAAVGA.GlyVc8jbyiW6NG0MVzCS0bOjtzBWvYRfjB9-gnkQaoQ
Logging in... done
Logged in as your_email_address
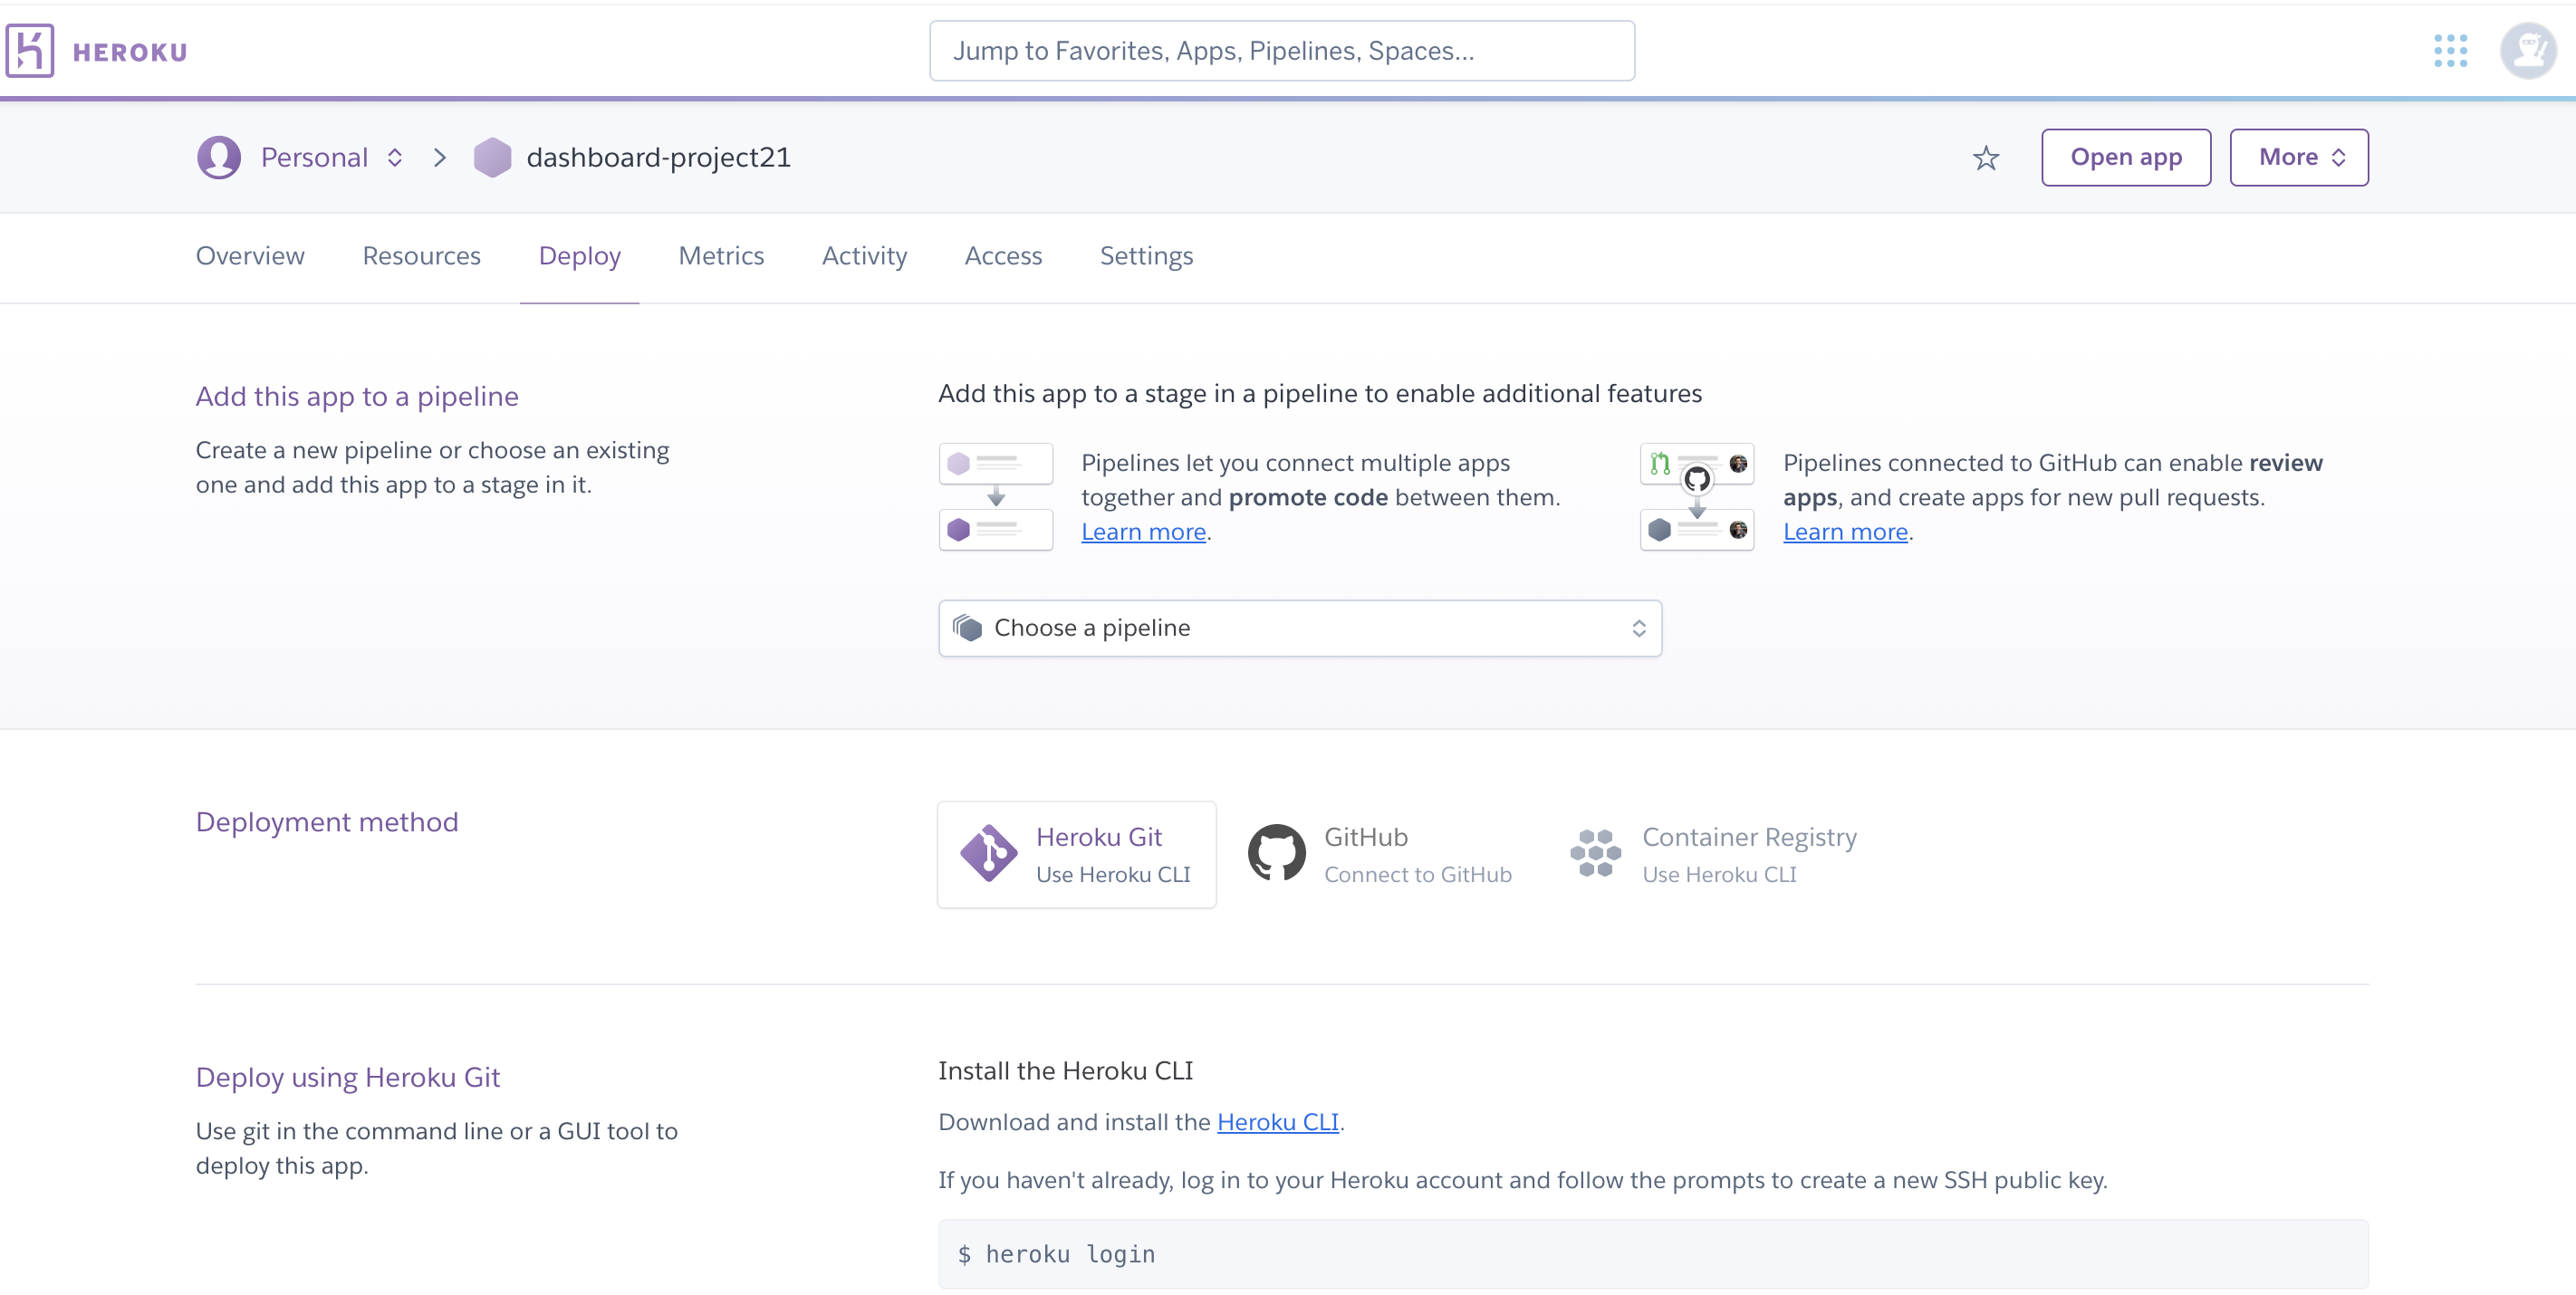
- 그리고, heroku 싸이트에 접속하여 각 명령어를 순서대로 입력한다.
- 이제 repository를 생성한다.
$ heroku git:remote -a dashboard-project21
set git remote heroku to https://git.heroku.com/dashboard-project21.git
- 이제 배포를 진행한다.
$ git add .
$ git commit -am "make it better"
$ git push
$ git push heroku main
- 이제 완성된 heroku-app을 확인한다.
Reference
- Develop Data Visualization Interfaces in Python With Dash, https://realpython.com/python-dash/
