기업 요청 샘플 (수강생) - Python Dash를 활용한 대시보드
Page content
강의 홍보
- 취준생을 위한 강의를 제작하였습니다.
- 본 블로그를 통해서 강의를 수강하신 분은 게시글 제목과 링크를 수강하여 인프런 메시지를 통해 보내주시기를 바랍니다.
스타벅스 아이스 아메리카노를 선물로 보내드리겠습니다.
- [비전공자 대환영] 제로베이스도 쉽게 입문하는 파이썬 데이터 분석 - 캐글입문기
개요
- 보안 로그 파일을 업로드한 뒤, 점검 결과를 자동으로 출력해주도록 한다.
- (수강생의 도전) 보안 로그 파일을 업로드 한 뒤, CPU 사용률이 70%가 넘으면 경고 메시지를 뛰우도록 한다.
Chapter 1. 로그데이터 분석 및 확인
- 먼저 CPU가 들어있는 로그데이터를 확인한다.
- 골든시스에서 제공한 Sample 데이터를 근거로 랜덤하게 데이터를 생성했다. 파일명:
(cpu_test.txt)
- 골든시스에서 제공한 Sample 데이터를 근거로 랜덤하게 데이터를 생성했다. 파일명:
Dorm_E_116.95#
Dorm_E_116.95#sh logg
Dorm_E_116.95#sh logging
Syslog logging: enabled (0 messages dropped, 1 messages rate-limited, 0 flushes, 0 overruns, xml disabled, filtering disabled)

No Active Message Discriminator.

No Inactive Message Discriminator.

    Console logging: level debugging, 2178 messages logged, xml disabled,
                     filtering disabled
    Monitor logging: level debugging, 244 messages logged, xml disabled,
                     filtering disabled
    Buffer logging:  level debugging, 2178 messages logged, xml disabled,
                    filtering disabled
    Exception Logging: size (4096 bytes)
    Count and timestamp logging messages: disabled
    File logging: disabled
    Persistent logging: disabled

No active filter modules.

    Trap logging: level informational, 2176 message lines logged
        Logging Source-Interface:       VRF Name:

Log Buffer (100000 bytes):
17:19:23: %PM-4-ERR_DISABLE: storm-control error detected on Gi1/0/36, putting Gi1/0/36 in err-disable state
Jul  7 17:19:23: %STORM_CONTROL-3-SHUTDOWN: A packet storm was detected on Gi1/0/36. The interface has been disabled.
Jul  7 17:19:25: %LINK-3-UPDOWN: Interface GigabitEthernet1/0/36, changed state to down
Jul  7 17:19:53: %PM-4-ERR_RECOVER: Attempting to recover from storm-control err-disable state on Gi1/0/36
Switch#show processor cpu
CPU utilization for five seconds: 4%/1%; one minute: 3%; five minutes: 3%
.
.
.
- 업무 수행 시, 위와 같은 데이터를 생성한다. 그 후에, 점검일지 파일을 작성한다.
- 점검일지 파일 Sample
/img/python/dash/dash_cpu_logdata/log_01.png

- 점검일지 파일 Sample
/img/python/dash/dash_cpu_logdata/log_01.png
(1) 문제점 진단
- 통상적으로 위와 같이 명령어를 입력한 뒤 결괏값을 찾아 수기로 입력하여 작성하도록 함
- 일일이 확인해야 하는 번거로움이 있다보니, 이를 자동으로 처리할 수 있는 툴 제작 의뢰를 받음
(2) 해결방안
- 명령어 및 결괏값이 일정한 패턴이 있기 때문에, 문자열 매칭을 통해 전처리가 가능한 것을 확인
- 또한, Dash 프레임워크를 통해 비교적 간단하게 대시보드를 만들 수 있음에 착안하였다.
(3) 배경지식
- 보안 관련 명령어 지식이 필요할 수도 있어서, 공유한다.
Chapter 2. 문자열 전처리 함수 만들기
- 우선 Jupyter Lab에서 간단한 테스트 함수를 만들어 보았다.
- 전체 코드는 아래와 같다.
- 파일을 불러온 뒤 우선 각 코드 라인 중에서
CPU utilization가 있는 텍스트만 남기고 그 외에는 모두 삭제한다. - 여기에서 다른 명령어의 결괏값을 확인하다면, if else 구문으로 계속적으로 확장할 수 있을 것이다.
- 그 후에, 각 re.sub 함수를 활용하여 수치만 뽑아낸다.
- 이를 각 데이터 프레임에 추가한 것이다.
- 파일을 불러온 뒤 우선 각 코드 라인 중에서
import pandas as pd
import re

def text_cleanser(FILE_PATH):
    with open(FILE_PATH, 'r') as f:
        logLines = f.read().splitlines()
    cleaned_lines = [x for x in logLines if "CPU utilization" in x]
    clean_text = re.sub('/[0-9]%', '', cleaned_lines[0])
    print("temp:", clean_text)
    result_list = re.findall("\d+", clean_text)
    return result_list

FILE_PATH = "data/cpu_test.txt"
result_list = text_cleanser(FILE_PATH)
result_list
- 위 파일을 Jupyter lab에서 실행하면 아래와 같은 결괏값이 출력될 것이다.
temp: CPU utilization for five seconds: 4%; one minute: 3%; five minutes: 3%
['4', '3', '3']
- 출력한 결과물을 pandas 데이터 프레임에 적용한 결과는 아래와 같다.
data = pd.DataFrame({"분류":["cpu"],
                     "점검내용": ["CPU 사용률 점검 및 불필요한 프로세스 확인"],
                     "점검기준": ["MEM 임계치: 70% (MAX)"],
                     "점검방법": ["show processes cpu | in five"],
                     "5초 동안 CPU 사용률": [result_list[0]],
                     "1분 동안 CPU 사용률": [result_list[1]],
                     "5분 동안 CPU 사용률": [result_list[2]],
                    })
data

Chapter 3. Dash 샘플 코드
- 우선 전체 코드를 공유한다.
- 먼저,
[app.py](http://app.py)코드를 공유한다.
import dash
import dash_core_components as dcc
import dash_html_components as html
import dash_table
from dash.dependencies import Input, Output, State

import pandas as pd

import base64
import re
import os

data = pd.DataFrame({"분류": ["cpu"],
                     "점검내용": ["CPU 사용률 점검 및 불필요한 프로세스 확인"],
                     "점검기준": ["MEM 임계치: 70% (MAX)"],
                     "점검방법": ["show processes cpu | in five"],
                     "5초 동안 CPU 사용률": ["측정 전"],
                     "1분 동안 CPU 사용률": ["측정 전"],
                     "5분 동안 CPU 사용률": ["측정 전"],
                     })

external_stylesheets = [
    {
        "href": "https://fonts.googleapis.com/css2?"
                "family=Lato:wght@400;700&display=swap",
        "rel": "stylesheet",
    },
]
app = dash.Dash(__name__, external_stylesheets=external_stylesheets,
                suppress_callback_exceptions=True,
                prevent_initial_callbacks=True)

app.title = "보안 점검일지 표"
server = app.server

app.layout = html.Div(
    children=[
        # title text
        html.Div(
            children=[
                html.H1(children="보안일지 점검 표 샘플", className="header_title"),
                html.P(children="!!!----!!!", className="header_description")
            ],  # children
            className='header',
        ), # html.Div

        # 파일 업로드
        html.Div(
            children=[
                html.Div(
                    children=[
                        dcc.Upload(
                            id='upload-data',
                            children=html.Div([
                                        'Drag and Drop or ',
                                    html.A('Select Files')
                            ]),
                            style={
                                'width': '100%',
                                'height': '60px',
                                'lineHeight': '60px',
                                'borderWidth': '1px',
                                'borderStyle': 'dashed',
                                'borderRadius': '5px',
                                'textAlign': 'center',
                                'margin': '10px'
                            },
                            # Allow multiple files to be uploaded
                            multiple=True
                        ),
                            html.Div(id='output-data-upload'),
                    ] # children
                ), # html.Div
            ], # children
            className='menu',
        ), # html.Div

        # Display
        html.Div(
            children=[
                html.Div(
                    children=dash_table.DataTable(
                        id = "data_id",
                        columns=[{"id":c, "name":c} for c in data.columns],
                        data = [],
                        style_cell={'textAlign': 'left',
                                    'whiteSpace': 'normal',
                                    'fontWeight': 'normal',
                                    'height': 'auto'
                                    },
                        style_header={
                            'backgroundColor': 'black',
                            'fontWeight': 'bold',
                            'color': 'white'
                        },
                        export_format="xlsx",
                    ) # children
                ) # Table
            ],
            className="wrapper",
        ), # html.Div
    ] # children
) # html.Div

UPLOAD_DIRECTORY = "/project/app_uploaded_files/"

if not os.path.exists(UPLOAD_DIRECTORY):
    os.makedirs(UPLOAD_DIRECTORY)

def text_cleanser(FILE_PATH):
    print("FILE_PATH", FILE_PATH)
    with open(FILE_PATH, 'r', encoding="utf-8") as f:
        logLines = f.read().splitlines()
    print("logLines:", logLines)
    cleaned_lines = [x for x in logLines if "CPU utilization" in x]
    clean_text = re.sub('/[0-9]%', '', cleaned_lines[0])
    print("temp:", clean_text)
    result_list = re.findall("\d+", clean_text)
    return result_list

def save_file(name, content):
    """Decode and store a file uploaded with Plotly Dash."""
    data = content.encode("utf8").split(b";base64,")[1]
    with open(os.path.join(UPLOAD_DIRECTORY, name), "wb") as fp:
        fp.write(base64.decodebytes(data))

def uploaded_files():
    """List the files in the upload directory."""
    files = []
    for filename in os.listdir(UPLOAD_DIRECTORY):
        path = os.path.join(UPLOAD_DIRECTORY, filename)
        if os.path.isfile(path):
            files.append(filename)
            return files

@app.callback(
    Output("data_id", "data"),
    [Input("upload-data", "filename"), Input("upload-data", "contents")],
)
def update_output(uploaded_filenames, uploaded_file_contents):
    """Save uploaded files and regenerate the file list."""

    if uploaded_filenames is not None and uploaded_file_contents is not None:
        for name, data in zip(uploaded_filenames, uploaded_file_contents):
            save_file(name, data)

    files = uploaded_files()
    if len(files) == 0:
       print("No files yet!")
    else:
       print("Files Okay")
    result_list = text_cleanser(UPLOAD_DIRECTORY + files[0])
    data = pd.DataFrame({"분류": ["cpu"],
                         "점검내용": ["CPU 사용률 점검 및 불필요한 프로세스 확인"],
                         "점검기준": ["MEM 임계치: 70% (MAX)"],
                         "점검방법": ["show processes cpu | in five"],
                         "5초 동안 CPU 사용률": [result_list[0]],
                         "1분 동안 CPU 사용률": [result_list[1]],
                         "5분 동안 CPU 사용률": [result_list[2]],
                         })
    print(data)
    return data.to_dict('records')

if __name__ == '__main__':
    app.run_server(debug=True)
- 다음은
style.css코드이다.- 해당 코드는
assets/style.css형태로 저장한다.
- 해당 코드는
body {
    font-family: "Lato", sans-serif;
    margin: 0;
    background-color: #F7F7F7;
}

.header {
    background-color: #222222;
    height: 288px;
    padding: 16px 0 0 0;
}

.header_title {
    color: #FFFFFF;
    font-size: 48px;
    font-weight: bold;
    text-align: center;
    margin: 0 auto;
}

.header_description {
    color: #CFCFCF;
    margin: 4px auto;
    text-align: center;
    max-width: 384px;
}

.menu {
    height: 130px;
    width: 912px;
    display: flex;
    justify-content: space-evenly;
    padding-top: 24px;
    margin: -80px auto 0 auto;
    background-color: #FFFFFF;
    box-shadow: 0 4px 6px 0 rgba(0, 0, 0, 0.18);
}

.naver_news_url {
    width: 100%;
}

.menu-title {
    margin-bottom: 6px;
    font-weight: normal;
    font-style: bold;
}

.url_sample {
    font-weight: normal;
    font-style: italic;
    font-size: 80%;
    color: #079A82;
}

.card {
    margin-bottom: 24px;
    box-shadow: 0 4px 6px 0 rgba(0, 0, 0, 0.18);
}

.wrapper {
    margin-right: auto;
    margin-left: auto;
    max-width: 1024px;
    padding-right: 10px;
    padding-left: 10px;
    margin-top: 32px;
}
- 폴더 구조를 보면 아래와 같다.
PS C:\Users\1\Desktop\dash-logReport> tree /f
폴더 PATH의 목록입니다.
볼륨 일련 번호는 E657-CFA3입니다.
C:.
│  app.py
├─assets
│      style.css
│
└─image
       cpu_test.txt
- 이제 터미널에서 아래와 같이
[app.py](http://app.py)를 실행한다.
PS C:\Users\1\Desktop\dash-logReport> python .\app.py
Dash is running on http://127.0.0.1:8050/

 * Serving Flask app 'app' (lazy loading)
 * Environment: production
   WARNING: This is a development server. Do not use it in a production deployment.
   Use a production WSGI server instead.
 * Debug mode: on
-
결과 화면을 확인해본다.
-
우선 첫 화면은 아래와 같을 것이다.
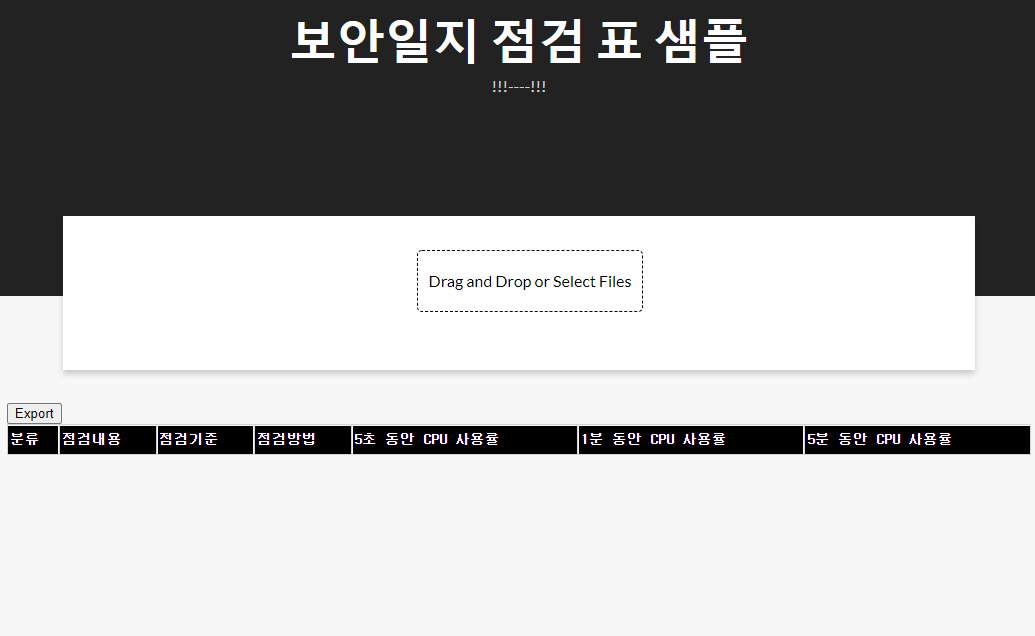
-
두번째 화면은
Drag and Drop or Select Files버튼을 클릭하여 로그 파일을 업로드 하면, 자동으로 전처리 한 결과를 반영한 것이다.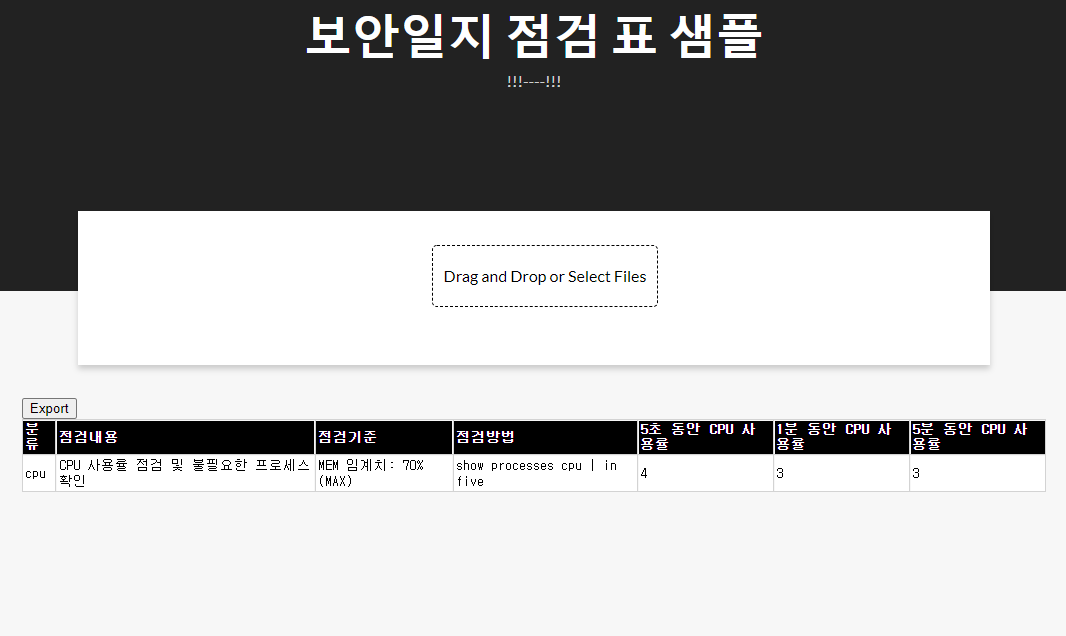
-
마지막은
Export버튼을 클릭하여엑셀 파일을 다운로드 받은 뒤 결과가 동일하게 나오는지 확인한다.
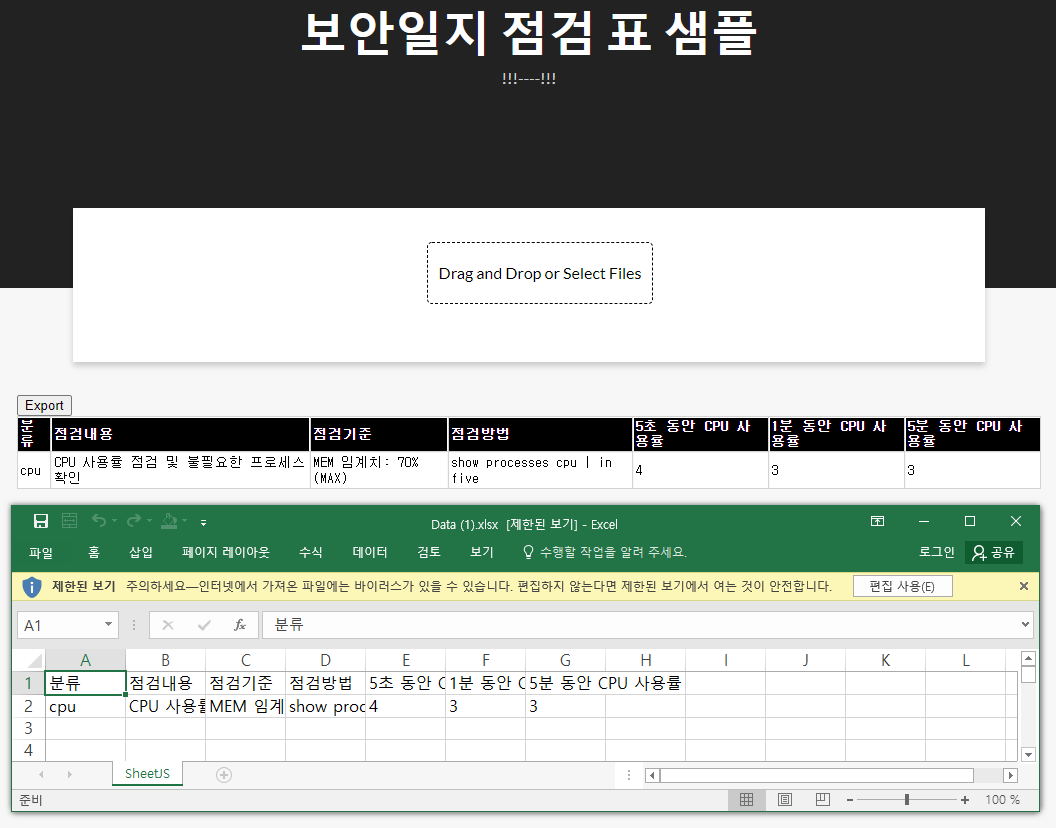
Chapter 4. 소스코드 리뷰
- 소스코드에 관한 간단한 리뷰를 진행한다.
(1) 라이브러리 불러오기
- 크게
dash와 관련된 라이브러리, 전처리(re)와 데이터프레임(pandas)과 관련된 라이브러리, 파이썬의 인코딩(base64)과 파일 경로(os)와 관련된 라이브러리로 구성이 되어 있다.
import dash
import dash_core_components as dcc
import dash_html_components as html
import dash_table
from dash.dependencies import Input, Output, State

import pandas as pd
import re

import base64
import os
(2) Dash 코드
- Dash Web 개발 관련 코드는 아래와 같다.
- 아래 코드에서의 핵심은
dcc.Upload이하의 절이다. 해당 코드에서 파일을 불러온 뒤, 서버에 임시적으로 저장을 해야 한다.- dcc.Upload의 ID는 id=‘upload-data’임을 기억한다.
- 그 외 나머지 코드는 그동안 배워온 코드와 유사하기에 추가 설명은 생략한다.
data = pd.DataFrame({"분류": ["cpu"],
                     "점검내용": ["CPU 사용률 점검 및 불필요한 프로세스 확인"],
                     "점검기준": ["MEM 임계치: 70% (MAX)"],
                     "점검방법": ["show processes cpu | in five"],
                     "5초 동안 CPU 사용률": ["측정 전"],
                     "1분 동안 CPU 사용률": ["측정 전"],
                     "5분 동안 CPU 사용률": ["측정 전"],
                     })

external_stylesheets = [
    {
        "href": "https://fonts.googleapis.com/css2?"
                "family=Lato:wght@400;700&display=swap",
        "rel": "stylesheet",
    },
]
app = dash.Dash(__name__, external_stylesheets=external_stylesheets,
                suppress_callback_exceptions=True,
                prevent_initial_callbacks=True)

app.title = "보안 점검일지 표"
server = app.server

app.layout = html.Div(
    children=[
        # title text
        html.Div(
            children=[
                html.H1(children="보안일지 점검 표 샘플", className="header_title"),
                html.P(children="!!!----!!!", className="header_description")
            ],  # children
            className='header',
        ), # html.Div

        # 파일 업로드
        html.Div(
            children=[
                html.Div(
                    children=[
                        dcc.Upload(
                            id='upload-data',
                            children=html.Div([
                                        'Drag and Drop or ',
                                    html.A('Select Files')
                            ]),
                            style={
                                'width': '100%',
                                'height': '60px',
                                'lineHeight': '60px',
                                'borderWidth': '1px',
                                'borderStyle': 'dashed',
                                'borderRadius': '5px',
                                'textAlign': 'center',
                                'margin': '10px'
                            },
                            # Allow multiple files to be uploaded
                            multiple=True
                        ),
                            html.Div(id='output-data-upload'),
                    ] # children
                ), # html.Div
            ], # children
            className='menu',
        ), # html.Div

        # Display
        html.Div(
            children=[
                html.Div(
                    children=dash_table.DataTable(
                        id = "data_id",
                        columns=[{"id":c, "name":c} for c in data.columns],
                        data = [],
                        style_cell={'textAlign': 'left',
                                    'whiteSpace': 'normal',
                                    'fontWeight': 'normal',
                                    'height': 'auto'
                                    },
                        style_header={
                            'backgroundColor': 'black',
                            'fontWeight': 'bold',
                            'color': 'white'
                        },
                        export_format="xlsx",
                    ) # children
                ) # Table
            ],
            className="wrapper",
        ), # html.Div
    ] # children
) # html.Div
(3) 데이터 처리 코드와 관련된 주요 설명
- 화면이 만들어졌다면, 이제는 데이터 처리 코드를 설명하도록 한다.
- 아래 코드는 앱 서버단에서 임시로 경로 및 폴더를 만드는 코드이다.
- 아래 경로에 업로드 된 파일이 임시로 저장될 것이다.
UPLOAD_DIRECTORY = "/project/app_uploaded_files/"

if not os.path.exists(UPLOAD_DIRECTORY):
    os.makedirs(UPLOAD_DIRECTORY)
- 다음 코드는
text_cleanser()코드이다. - 기존 코드와 큰 차이점은 없고, 다만, 중간에 파일이 잘 불러와지는지 확인하기 위해
print()함수를 사용했다.
def text_cleanser(FILE_PATH):
    print("FILE_PATH", FILE_PATH)
    with open(FILE_PATH, 'r', encoding="utf-8") as f:
        logLines = f.read().splitlines()
    print("logLines:", logLines)
    cleaned_lines = [x for x in logLines if "CPU utilization" in x]
    clean_text = re.sub('/[0-9]%', '', cleaned_lines[0])
    print("temp:", clean_text)
    result_list = re.findall("\d+", clean_text)
    return result_list
- 다음 코드는
save_file()이다. - 파일이 업로드 될 때, 다이렉트로 해당 파일을 활용할 수 없다. Flash 기반의 서버에 저장시키기 위해 인코딩 작업을 거친 뒤,
UPLOAD_DIRECTORY경로에 다시 파일을 작성하는 과정을 거친다.- 특히 인코딩 프로세스는
csv또는xlsx파일을 업로드 할 때도 동일하다. - 참조: https://dash.plotly.com/dash-core-components/upload
- 특히 인코딩 프로세스는
def save_file(name, content):
    """Decode and store a file uploaded with Plotly Dash."""
    data = content.encode("utf8").split(b";base64,")[1]
    with open(os.path.join(UPLOAD_DIRECTORY, name), "wb") as fp:
        fp.write(base64.decodebytes(data))
- 다음 코드는
uploaded_files()이다. - 지정된 경로에서 저장된 파일을 불러오는 것이다.
- 여기에서는
cpu_test.txt파일을 가져오게 될 것이다.
- 여기에서는
def uploaded_files():
    """List the files in the upload directory."""
    files = []
    for filename in os.listdir(UPLOAD_DIRECTORY):
        path = os.path.join(UPLOAD_DIRECTORY, filename)
        if os.path.isfile(path):
            files.append(filename)
            return files
-
사전에 데이터 처리와 관련된 함수를 만들었다면, 이번에는 실제로 적용을 하도록 한다.
-
여기에서 callback이 처리하는 전체적인 처리 순서를 그림으로 표현하면 아래와 같다.
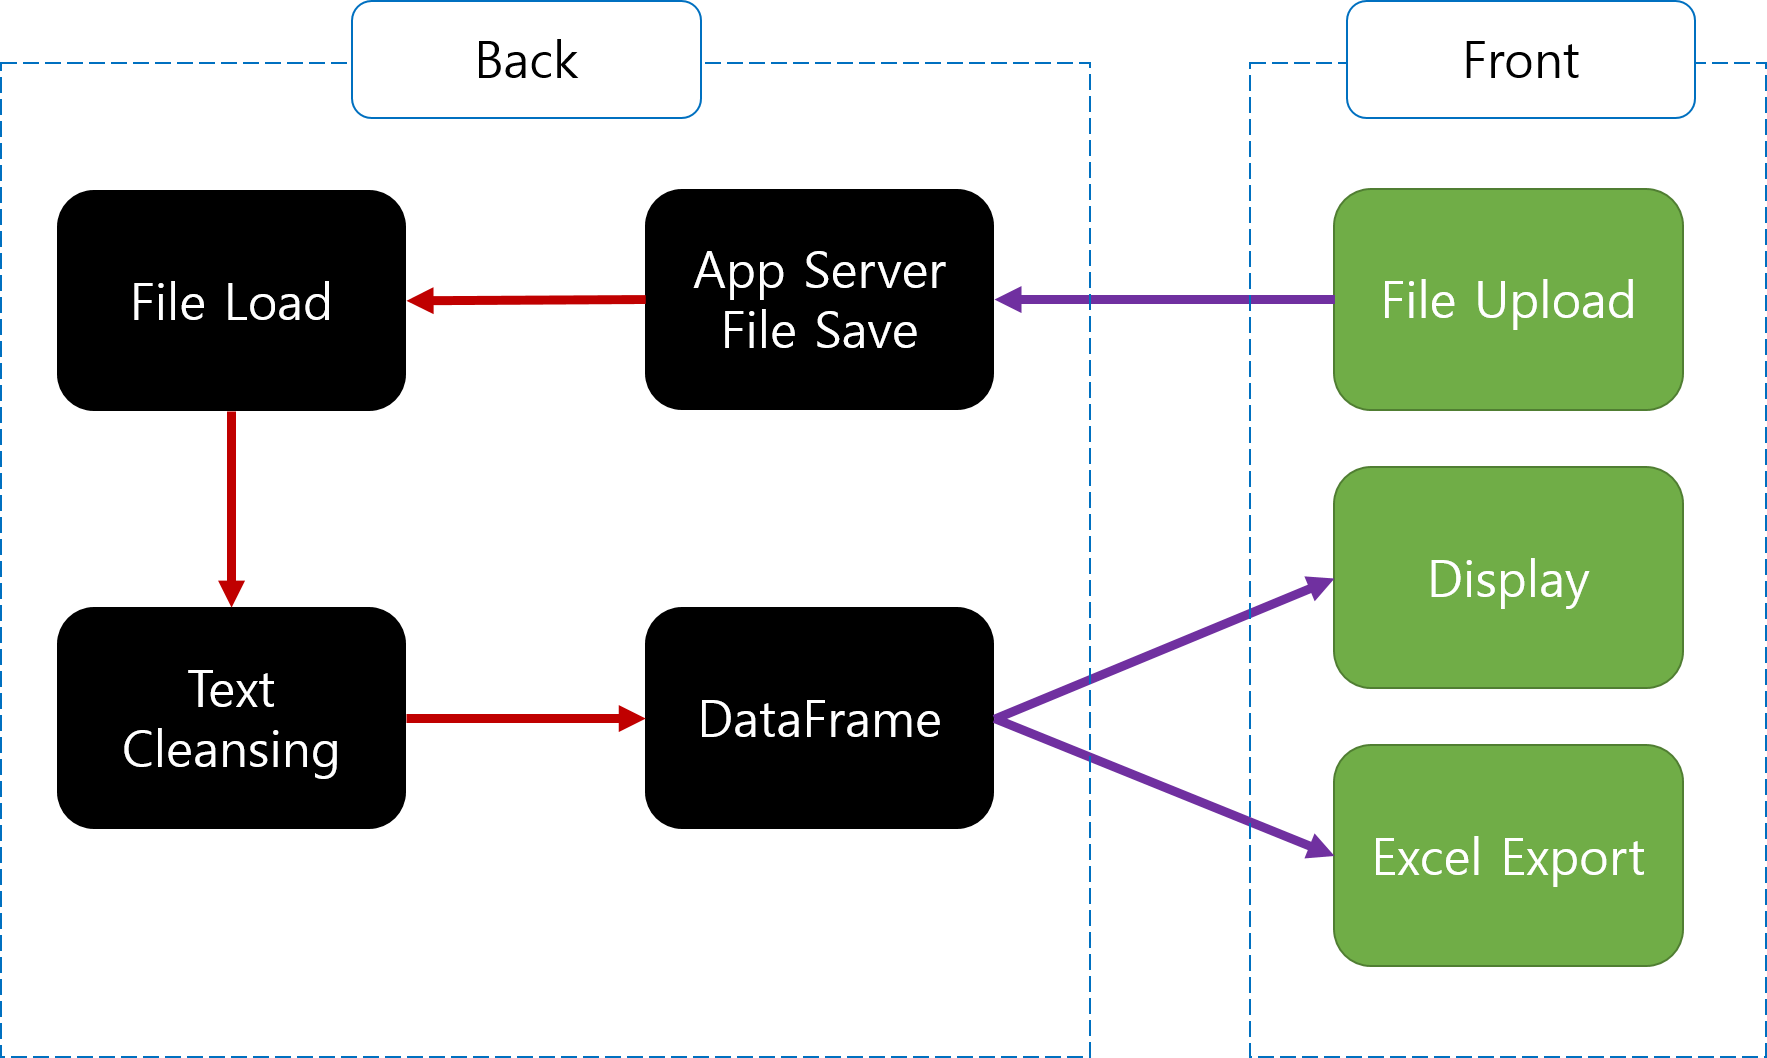
-
위 그림과 같은 프로세스를 처리하기 위해
callback처리 코드를 작성한다. -
최종적인 output의 결과는 data로 처리가 된다.
-
또한,
save file(),uploaded_files(),text_cleanser()함수가 순차적으로 사용된 것을 확인할 수 있다. -
이미
text_cleanser()내부에서 pandas 데이터프레임으로 변환하는 코드를 이미 실습했기 때문에 여기에서는 추가적인 설명은 생략한다.
@app.callback(
    Output("data_id", "data"),
    [Input("upload-data", "filename"), Input("upload-data", "contents")],
)
def update_output(uploaded_filenames, uploaded_file_contents):
    """Save uploaded files and regenerate the file list."""

    if uploaded_filenames is not None and uploaded_file_contents is not None:
        for name, data in zip(uploaded_filenames, uploaded_file_contents):
            save_file(name, data)

    files = uploaded_files()
    if len(files) == 0:
       print("No files yet!")
    else:
       print("Files Okay")
    result_list = text_cleanser(UPLOAD_DIRECTORY + files[0])
    data = pd.DataFrame({"분류": ["cpu"],
                         "점검내용": ["CPU 사용률 점검 및 불필요한 프로세스 확인"],
                         "점검기준": ["MEM 임계치: 70% (MAX)"],
                         "점검방법": ["show processes cpu | in five"],
                         "5초 동안 CPU 사용률": [result_list[0]],
                         "1분 동안 CPU 사용률": [result_list[1]],
                         "5분 동안 CPU 사용률": [result_list[2]],
                         })
    print(data)
    return data.to_dict('records')
- 이제 마지막으로 app을 실행하는 코드를 작성한다.
if __name__ == '__main__':
    app.run_server(debug=True)
Chapter 5. 수강생들의 도전
- 위 코드는 아직까지 경고 메시지를 알려주는 기능은 없다. 즉, 수치만 뽑아낸 것일 뿐, 수치를 활용하여 특정한 임계치를 넘어설 때, 알람이 있는 건 아니다.
- 따라서, 이 부분을 보완하여 웹에 표시를 하도록 해본다.
