Streamlit on Google Colab
Page content
개요
- 개발환경설정이 어려운 환경에서 Google Colab 상에서 Streamlit 설치 및 실행을 익히고자 한다.
- 주로 강의 목적으로 사용하기를 바란다.
Streamlit 라이브러리 설치
- 아래 코드를 활용하여 streamlit 라이브러리 설치
!pip install -q streamlit

Streamlit 코드 작성 샘플
- 아래와 같이 코드를 작성 후, app.py로 내보내기를 한다.
- magics from Jupyter : [Jupyter’s magics page](https://nbviewer.org/github/ipython/ipython/blob/1.x/examples/notebooks/Cell Magics.ipynb)
%%writefile app.py

import streamlit as st
import plotly.graph_objs as go
from plotly.subplots import make_subplots
import seaborn as sns

@st.cache_data
def load_data():
    df = sns.load_dataset('tips')
    return df

def main():
    st.title("Streamlit with Plotly")
    tips = load_data()

    # 데이터가공
    m_tips = tips.loc[tips['sex'] == 'Male', :]
    f_tips = tips.loc[tips['sex'] == 'Female', :]

    # 시각화 차트
    fig = make_subplots(rows = 1,
                        cols = 2,
                        subplot_titles=('Male', 'Female'),
                        shared_yaxes=True,
                        shared_xaxes=True,
                        x_title='Total Bill($)'
                        )
    fig.add_trace(go.Scatter(x = m_tips['total_bill'], y = m_tips['tip'], mode='markers'), row=1, col=1)
    fig.add_trace(go.Scatter(x = f_tips['total_bill'], y = f_tips['tip'], mode='markers'), row=1, col=2)
    fig.update_yaxes(title_text="Tip($)", row=1, col=1)
    fig.update_xaxes(range=[0, 60])
    fig.update_layout(showlegend=False)

    # 중요포인트
    # fig.show()
    st.plotly_chart(fig, use_container_width=True)

if __name__ == "__main__":
    main()

install localtunnel
- npm 명령어를 활용하여 설치
!npm install localtunnel

Streamlit 실행
- 실행 코드는 다음과 같다.
- 아래 실행 화면에서
34.45.94.54는 비밀번호를 의미한다. - url을 클릭한다.
!streamlit run /content/app.py &>/content/logs.txt & npx localtunnel --port 8501 & curl ipv4.icanhazip.com

- 아래 화면에서 Tunnel Password에
34.45.94.54를 입력한다.- 각 사용자마다 번호는 다를 수 있다.
- 입력 후
Click to Submit버튼을 클릭한다.

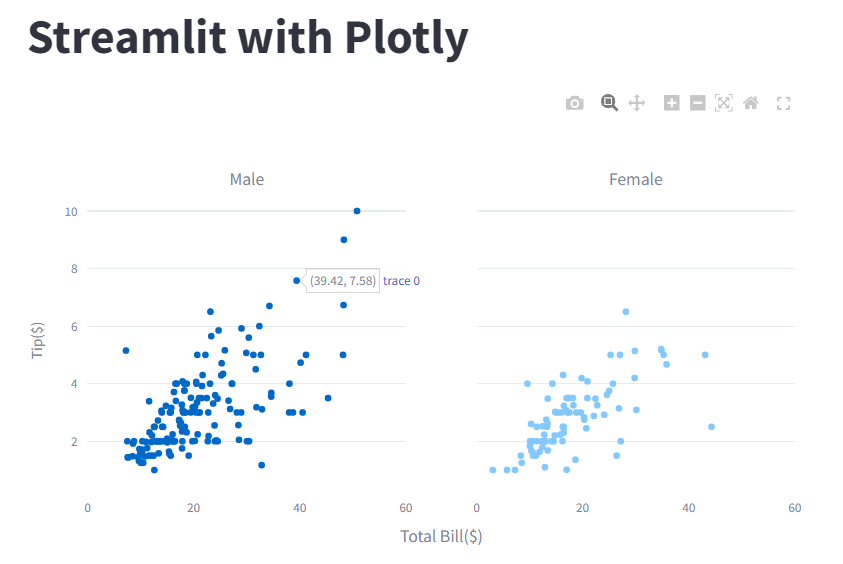
Streamlit 화면 확인
- 웹사이트에서 아래와 같이 나오는지 화면 확인

