EDA with Housing Price Prediction - Handling Date
Page content
강의 홍보
- 취준생을 위한 강의를 제작하였습니다.
- 본 블로그를 통해서 강의를 수강하신 분은 게시글 제목과 링크를 수강하여 인프런 메시지를 통해 보내주시기를 바랍니다.
스타벅스 아이스 아메리카노를 선물로 보내드리겠습니다.
- [비전공자 대환영] 제로베이스도 쉽게 입문하는 파이썬 데이터 분석 - 캐글입문기

I. 개요
- 이제 본격적으로 Kaggle 데이터를 활용하여 분석을 진행한다.
- 데이터는 이미 다운 받은 상태를 전제로 하며, 만약에 데이터가 없다면 이전 포스팅에서 절차를 확인하기 바란다. (미리보기 가능)
II. 구글 드라이브 연동
- 구글 코랩을 시작하면 언제든지 가장 먼저 해야 하는 것은 드라이브 연동이다.
from google.colab import drive # 패키지 불러오기
from os.path import join

ROOT = "/content/drive"     # 드라이브 기본 경로
print(ROOT)                 # print content of ROOT (Optional)
drive.mount(ROOT)           # 드라이브 기본 경로 Mount

MY_GOOGLE_DRIVE_PATH = 'My Drive/Colab Notebooks/inflearn_kaggle/' # 프로젝트 경로
PROJECT_PATH = join(ROOT, MY_GOOGLE_DRIVE_PATH) # 프로젝트 경로
print(PROJECT_PATH)
/content/drive
Go to this URL in a browser: https://accounts.google.com/o/oauth2/auth?client_id=947318989803-6bn6qk8qdgf4n4g3pfee6491hc0brc4i.apps.googleusercontent.com&redirect_uri=urn%3aietf%3awg%3aoauth%3a2.0%3aoob&response_type=code&scope=email%20https%3a%2f%2fwww.googleapis.com%2fauth%2fdocs.test%20https%3a%2f%2fwww.googleapis.com%2fauth%2fdrive%20https%3a%2f%2fwww.googleapis.com%2fauth%2fdrive.photos.readonly%20https%3a%2f%2fwww.googleapis.com%2fauth%2fpeopleapi.readonly

Enter your authorization code:
··········
Mounted at /content/drive
/content/drive/My Drive/Colab Notebooks/inflearn_kaggle/
%cd "{PROJECT_PATH}"
/content/drive/My Drive/Colab Notebooks/inflearn_kaggle
- 위 코드가 에러 없이 돌아간다면 이제 데이터를 불러올 차례다.
!ls
data docs source
- 필자는
inflearn_kaggle폴더안에data,docs,source등의 하위 폴더를 추가로 만들었다. - 즉,
data안에 다운로드 받은 파일이 있을 것이다.
III. 캐글 데이터 수집 및 EDA
- 우선 데이터를 수집하기에 앞서서
EDA에 관한 필수 패키지를 설치하자.
import pandas as pd
import pandas_profiling
import numpy as np
import matplotlib as mpl
import matplotlib.pyplot as plt
from matplotlib.pyplot import figure
import seaborn as sns

from IPython.core.display import display, HTML
from pandas_profiling import ProfileReport
%matplotlib inline
import matplotlib.pylab as plt

plt.rcParams["figure.figsize"] = (14,4)
plt.rcParams['lines.linewidth'] = 2
plt.rcParams['lines.color'] = 'r'
plt.rcParams['axes.grid'] = True
(1) 데이터 수집
- 지난 시간에 받은 데이터가 총 4개임을 확인했다.
- data_description.txt
- sample_submission.csv
- test.csv
- train.csv
- 여기에서는 우선
test.csv&train.csv파일을 받도록 한다.
train = pd.read_csv('data/train.csv')
test = pd.read_csv('data/test.csv')
print("data import is done")
data import is done
(2) 데이터 확인
Kaggle데이터를 불러오면 우선 확인해야 하는 것은 데이터셋의 크기다.- 변수의 갯수
- Numeric 변수 & Categorical 변수의 개수 등을 파악해야 한다.
- Point 1 -
train데이터에서 굳이 훈련데이터와 테스트 데이터를 구분할 필요는 없다.- 보통
Kaggle에서는 테스트 데이터를 주기적으로 업데이트 해준다.
- 보통
- Point 2 - 보통
test데이터의 변수의 개수가 하나 더 작다.
train.shape, test.shape
((1460, 81), (1459, 80))
- 그 후
train데이터의상위 5개의 데이터만 확인한다.
display(train)
| Id | MSSubClass | MSZoning | LotFrontage | LotArea | Street | Alley | LotShape | LandContour | Utilities | LotConfig | LandSlope | Neighborhood | Condition1 | Condition2 | BldgType | HouseStyle | OverallQual | OverallCond | YearBuilt | YearRemodAdd | RoofStyle | RoofMatl | Exterior1st | Exterior2nd | MasVnrType | MasVnrArea | ExterQual | ExterCond | Foundation | BsmtQual | BsmtCond | BsmtExposure | BsmtFinType1 | BsmtFinSF1 | BsmtFinType2 | BsmtFinSF2 | BsmtUnfSF | TotalBsmtSF | Heating | ... | CentralAir | Electrical | 1stFlrSF | 2ndFlrSF | LowQualFinSF | GrLivArea | BsmtFullBath | BsmtHalfBath | FullBath | HalfBath | BedroomAbvGr | KitchenAbvGr | KitchenQual | TotRmsAbvGrd | Functional | Fireplaces | FireplaceQu | GarageType | GarageYrBlt | GarageFinish | GarageCars | GarageArea | GarageQual | GarageCond | PavedDrive | WoodDeckSF | OpenPorchSF | EnclosedPorch | 3SsnPorch | ScreenPorch | PoolArea | PoolQC | Fence | MiscFeature | MiscVal | MoSold | YrSold | SaleType | SaleCondition | SalePrice | |
|---|---|---|---|---|---|---|---|---|---|---|---|---|---|---|---|---|---|---|---|---|---|---|---|---|---|---|---|---|---|---|---|---|---|---|---|---|---|---|---|---|---|---|---|---|---|---|---|---|---|---|---|---|---|---|---|---|---|---|---|---|---|---|---|---|---|---|---|---|---|---|---|---|---|---|---|---|---|---|---|---|---|
| 0 | 1 | 60 | RL | 65.0 | 8450 | Pave | NaN | Reg | Lvl | AllPub | Inside | Gtl | CollgCr | Norm | Norm | 1Fam | 2Story | 7 | 5 | 2003 | 2003 | Gable | CompShg | VinylSd | VinylSd | BrkFace | 196.0 | Gd | TA | PConc | Gd | TA | No | GLQ | 706 | Unf | 0 | 150 | 856 | GasA | ... | Y | SBrkr | 856 | 854 | 0 | 1710 | 1 | 0 | 2 | 1 | 3 | 1 | Gd | 8 | Typ | 0 | NaN | Attchd | 2003.0 | RFn | 2 | 548 | TA | TA | Y | 0 | 61 | 0 | 0 | 0 | 0 | NaN | NaN | NaN | 0 | 2 | 2008 | WD | Normal | 208500 |
| 1 | 2 | 20 | RL | 80.0 | 9600 | Pave | NaN | Reg | Lvl | AllPub | FR2 | Gtl | Veenker | Feedr | Norm | 1Fam | 1Story | 6 | 8 | 1976 | 1976 | Gable | CompShg | MetalSd | MetalSd | None | 0.0 | TA | TA | CBlock | Gd | TA | Gd | ALQ | 978 | Unf | 0 | 284 | 1262 | GasA | ... | Y | SBrkr | 1262 | 0 | 0 | 1262 | 0 | 1 | 2 | 0 | 3 | 1 | TA | 6 | Typ | 1 | TA | Attchd | 1976.0 | RFn | 2 | 460 | TA | TA | Y | 298 | 0 | 0 | 0 | 0 | 0 | NaN | NaN | NaN | 0 | 5 | 2007 | WD | Normal | 181500 |
| 2 | 3 | 60 | RL | 68.0 | 11250 | Pave | NaN | IR1 | Lvl | AllPub | Inside | Gtl | CollgCr | Norm | Norm | 1Fam | 2Story | 7 | 5 | 2001 | 2002 | Gable | CompShg | VinylSd | VinylSd | BrkFace | 162.0 | Gd | TA | PConc | Gd | TA | Mn | GLQ | 486 | Unf | 0 | 434 | 920 | GasA | ... | Y | SBrkr | 920 | 866 | 0 | 1786 | 1 | 0 | 2 | 1 | 3 | 1 | Gd | 6 | Typ | 1 | TA | Attchd | 2001.0 | RFn | 2 | 608 | TA | TA | Y | 0 | 42 | 0 | 0 | 0 | 0 | NaN | NaN | NaN | 0 | 9 | 2008 | WD | Normal | 223500 |
| 3 | 4 | 70 | RL | 60.0 | 9550 | Pave | NaN | IR1 | Lvl | AllPub | Corner | Gtl | Crawfor | Norm | Norm | 1Fam | 2Story | 7 | 5 | 1915 | 1970 | Gable | CompShg | Wd Sdng | Wd Shng | None | 0.0 | TA | TA | BrkTil | TA | Gd | No | ALQ | 216 | Unf | 0 | 540 | 756 | GasA | ... | Y | SBrkr | 961 | 756 | 0 | 1717 | 1 | 0 | 1 | 0 | 3 | 1 | Gd | 7 | Typ | 1 | Gd | Detchd | 1998.0 | Unf | 3 | 642 | TA | TA | Y | 0 | 35 | 272 | 0 | 0 | 0 | NaN | NaN | NaN | 0 | 2 | 2006 | WD | Abnorml | 140000 |
| 4 | 5 | 60 | RL | 84.0 | 14260 | Pave | NaN | IR1 | Lvl | AllPub | FR2 | Gtl | NoRidge | Norm | Norm | 1Fam | 2Story | 8 | 5 | 2000 | 2000 | Gable | CompShg | VinylSd | VinylSd | BrkFace | 350.0 | Gd | TA | PConc | Gd | TA | Av | GLQ | 655 | Unf | 0 | 490 | 1145 | GasA | ... | Y | SBrkr | 1145 | 1053 | 0 | 2198 | 1 | 0 | 2 | 1 | 4 | 1 | Gd | 9 | Typ | 1 | TA | Attchd | 2000.0 | RFn | 3 | 836 | TA | TA | Y | 192 | 84 | 0 | 0 | 0 | 0 | NaN | NaN | NaN | 0 | 12 | 2008 | WD | Normal | 250000 |
| ... | ... | ... | ... | ... | ... | ... | ... | ... | ... | ... | ... | ... | ... | ... | ... | ... | ... | ... | ... | ... | ... | ... | ... | ... | ... | ... | ... | ... | ... | ... | ... | ... | ... | ... | ... | ... | ... | ... | ... | ... | ... | ... | ... | ... | ... | ... | ... | ... | ... | ... | ... | ... | ... | ... | ... | ... | ... | ... | ... | ... | ... | ... | ... | ... | ... | ... | ... | ... | ... | ... | ... | ... | ... | ... | ... | ... | ... | ... | ... | ... | ... |
| 1455 | 1456 | 60 | RL | 62.0 | 7917 | Pave | NaN | Reg | Lvl | AllPub | Inside | Gtl | Gilbert | Norm | Norm | 1Fam | 2Story | 6 | 5 | 1999 | 2000 | Gable | CompShg | VinylSd | VinylSd | None | 0.0 | TA | TA | PConc | Gd | TA | No | Unf | 0 | Unf | 0 | 953 | 953 | GasA | ... | Y | SBrkr | 953 | 694 | 0 | 1647 | 0 | 0 | 2 | 1 | 3 | 1 | TA | 7 | Typ | 1 | TA | Attchd | 1999.0 | RFn | 2 | 460 | TA | TA | Y | 0 | 40 | 0 | 0 | 0 | 0 | NaN | NaN | NaN | 0 | 8 | 2007 | WD | Normal | 175000 |
| 1456 | 1457 | 20 | RL | 85.0 | 13175 | Pave | NaN | Reg | Lvl | AllPub | Inside | Gtl | NWAmes | Norm | Norm | 1Fam | 1Story | 6 | 6 | 1978 | 1988 | Gable | CompShg | Plywood | Plywood | Stone | 119.0 | TA | TA | CBlock | Gd | TA | No | ALQ | 790 | Rec | 163 | 589 | 1542 | GasA | ... | Y | SBrkr | 2073 | 0 | 0 | 2073 | 1 | 0 | 2 | 0 | 3 | 1 | TA | 7 | Min1 | 2 | TA | Attchd | 1978.0 | Unf | 2 | 500 | TA | TA | Y | 349 | 0 | 0 | 0 | 0 | 0 | NaN | MnPrv | NaN | 0 | 2 | 2010 | WD | Normal | 210000 |
| 1457 | 1458 | 70 | RL | 66.0 | 9042 | Pave | NaN | Reg | Lvl | AllPub | Inside | Gtl | Crawfor | Norm | Norm | 1Fam | 2Story | 7 | 9 | 1941 | 2006 | Gable | CompShg | CemntBd | CmentBd | None | 0.0 | Ex | Gd | Stone | TA | Gd | No | GLQ | 275 | Unf | 0 | 877 | 1152 | GasA | ... | Y | SBrkr | 1188 | 1152 | 0 | 2340 | 0 | 0 | 2 | 0 | 4 | 1 | Gd | 9 | Typ | 2 | Gd | Attchd | 1941.0 | RFn | 1 | 252 | TA | TA | Y | 0 | 60 | 0 | 0 | 0 | 0 | NaN | GdPrv | Shed | 2500 | 5 | 2010 | WD | Normal | 266500 |
| 1458 | 1459 | 20 | RL | 68.0 | 9717 | Pave | NaN | Reg | Lvl | AllPub | Inside | Gtl | NAmes | Norm | Norm | 1Fam | 1Story | 5 | 6 | 1950 | 1996 | Hip | CompShg | MetalSd | MetalSd | None | 0.0 | TA | TA | CBlock | TA | TA | Mn | GLQ | 49 | Rec | 1029 | 0 | 1078 | GasA | ... | Y | FuseA | 1078 | 0 | 0 | 1078 | 1 | 0 | 1 | 0 | 2 | 1 | Gd | 5 | Typ | 0 | NaN | Attchd | 1950.0 | Unf | 1 | 240 | TA | TA | Y | 366 | 0 | 112 | 0 | 0 | 0 | NaN | NaN | NaN | 0 | 4 | 2010 | WD | Normal | 142125 |
| 1459 | 1460 | 20 | RL | 75.0 | 9937 | Pave | NaN | Reg | Lvl | AllPub | Inside | Gtl | Edwards | Norm | Norm | 1Fam | 1Story | 5 | 6 | 1965 | 1965 | Gable | CompShg | HdBoard | HdBoard | None | 0.0 | Gd | TA | CBlock | TA | TA | No | BLQ | 830 | LwQ | 290 | 136 | 1256 | GasA | ... | Y | SBrkr | 1256 | 0 | 0 | 1256 | 1 | 0 | 1 | 1 | 3 | 1 | TA | 6 | Typ | 0 | NaN | Attchd | 1965.0 | Fin | 1 | 276 | TA | TA | Y | 736 | 68 | 0 | 0 | 0 | 0 | NaN | NaN | NaN | 0 | 6 | 2008 | WD | Normal | 147500 |
1460 rows × 81 columns
- 그 다음 확인해야 하는 것은
Numerical변수와Categorical변수를 구분한다.- 먼저
numerical_features를 구분하자.
- 먼저
numeric_features = train.select_dtypes(include=[np.number])
print(numeric_features.columns)
print("The total number of numeric features are: ", len(numeric_features.columns))
Index(['Id', 'MSSubClass', 'LotFrontage', 'LotArea', 'OverallQual',
       'OverallCond', 'YearBuilt', 'YearRemodAdd', 'MasVnrArea', 'BsmtFinSF1',
       'BsmtFinSF2', 'BsmtUnfSF', 'TotalBsmtSF', '1stFlrSF', '2ndFlrSF',
       'LowQualFinSF', 'GrLivArea', 'BsmtFullBath', 'BsmtHalfBath', 'FullBath',
       'HalfBath', 'BedroomAbvGr', 'KitchenAbvGr', 'TotRmsAbvGrd',
       'Fireplaces', 'GarageYrBlt', 'GarageCars', 'GarageArea', 'WoodDeckSF',
       'OpenPorchSF', 'EnclosedPorch', '3SsnPorch', 'ScreenPorch', 'PoolArea',
       'MiscVal', 'MoSold', 'YrSold', 'SalePrice'],
      dtype='object')
The total number of numeric features are:  38
numeric_features을 제외한 나머지 변수를 추출하자.
categorical_features = train.select_dtypes(exclude=[np.number])
print(categorical_features.columns)
print("The total number of numeric features are: ", len(categorical_features.columns))
Index(['MSZoning', 'Street', 'Alley', 'LotShape', 'LandContour', 'Utilities',
       'LotConfig', 'LandSlope', 'Neighborhood', 'Condition1', 'Condition2',
       'BldgType', 'HouseStyle', 'RoofStyle', 'RoofMatl', 'Exterior1st',
       'Exterior2nd', 'MasVnrType', 'ExterQual', 'ExterCond', 'Foundation',
       'BsmtQual', 'BsmtCond', 'BsmtExposure', 'BsmtFinType1', 'BsmtFinType2',
       'Heating', 'HeatingQC', 'CentralAir', 'Electrical', 'KitchenQual',
       'Functional', 'FireplaceQu', 'GarageType', 'GarageFinish', 'GarageQual',
       'GarageCond', 'PavedDrive', 'PoolQC', 'Fence', 'MiscFeature',
       'SaleType', 'SaleCondition'],
      dtype='object')
The total number of numeric features are:  43
IV. 연도 데이터 탐색 개요
-
지난시간에 각 데이터에서
categorical_features와numeric_features를 각각 추출하는 방법에 대해 배웠다.- categorical_features: Alley, BldgType, BsmtCond, BsmtExposure, BsmtFinType1, BsmtFinType2, BsmtQual, CentralAir, Condition1, Condition2, Electrical, ExterCond, ExterQual, Exterior1st, Exterior2nd, Fence, FireplaceQu, Foundation, Functional, GarageCond, GarageFinish, GarageQual, GarageType, Heating, HeatingQC, HouseStyle, KitchenQual, LandContour, LandSlope, LotConfig, LotShape, MSZoning, MasVnrType, MiscFeature, Neighborhood, PavedDrive, PoolQC, RoofMatl, RoofStyle, SaleCondition, SaleType, Street, Utilitif
- numeric_features:‘Id’, ‘MSSubClass’, ‘LotFrontage’, ‘LotArea’, ‘OverallQual’, ‘OverallCond’, ‘YearBuilt’, ‘YearRemodAdd’, ‘MasVnrArea’, ‘BsmtFinSF1’, ‘BsmtFinSF2’, ‘BsmtUnfSF’, ‘TotalBsmtSF’, ‘1stFlrSF’, ‘2ndFlrSF’, ‘LowQualFinSF’, ‘GrLivArea’, ‘BsmtFullBath’, ‘BsmtHalfBath’, ‘FullBath’, ‘HalfBath’, ‘BedroomAbvGr’, ‘KitchenAbvGr’, ‘TotRmsAbvGrd’, ‘Fireplaces’, ‘GarageYrBlt’, ‘GarageCars’, ‘GarageArea’, ‘WoodDeckSF’, ‘OpenPorchSF’, ‘EnclosedPorch’, ‘3SsnPorch’, ‘ScreenPorch’, ‘PoolArea’, ‘MiscVal’, ‘MoSold’, ‘YrSold’, ‘SalePrice’
-
여기에서 우선
categorical_features는 논의에서 제외한다. -
이 중에서, 우선
numeric_features를 다시 살펴본다.- 우선 훈련데이터의
ID는 삭제한다. - 또한, 종속변수인
salesprice는 테스트 데이터에는 존재하지 않는다. - 그럼 결과적으로
36개의numeric_features만 남게 된다.
- 우선 훈련데이터의
-
36개의
features만 남았다.- 여기에서 유심히 살펴보면
Year과 관련된features가 보인다.
- 여기에서 유심히 살펴보면
-
특히 매출과 관련된 데이터를 다루는데 있어서,
연,월,일은 매우 중요하다. 패턴을 찾아서 특정 변수만 추출하는 코드가 필요하다.YearBuilt,YearRemodAdd,GarageYrBlt,YrSold만 추출해보자.
year_fea = [fea for fea in numeric_features if 'Yr' in fea or 'Year' in fea]
print(year_fea)
['YearBuilt', 'YearRemodAdd', 'GarageYrBlt', 'YrSold']
(1) 연도의 변수 처리 방법
- 여기에서 잊지 말아야 하는 것은 새로운 데이터셋을 만들더라도 항상 종속변수(
sales price)는 늘 함께 움직여야 한다. - 각각의 변수는 어떻게 이해해야 할까?
- 이 때, 필요한 것이 일종의
데이터 정의서가 필요하다. data_description.txt를 참고하자.
- 이 때, 필요한 것이 일종의
- 각 변수는 다음과 같다.
- YearBuilt: Original construction date
- YearRemodAdd: Remodel date (same as construction date if no remodeling or additions)
- GarageYrBlt: Year garage was built
- YrSold: Year Sold (YYYY)
- 여기에서 우선 각 변수별로 연도가 차이가 나는지 확인해보자.
for fea in year_fea:
  data = train.copy()
  data[fea].value_counts(sort=False).plot(kind='bar')
  plt.xlabel(fea)
  plt.title(fea)
  plt.show()
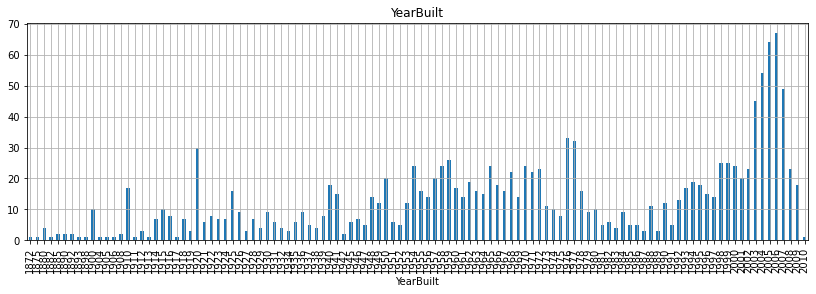
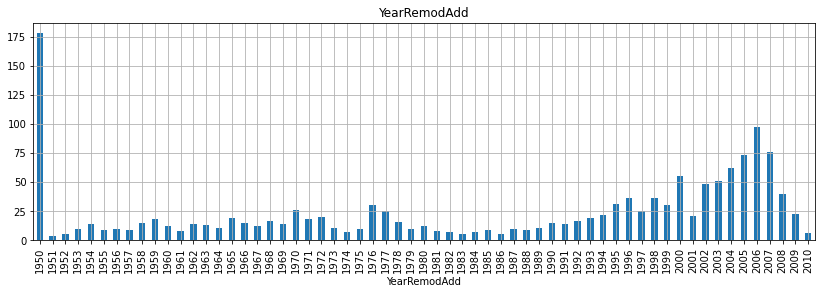
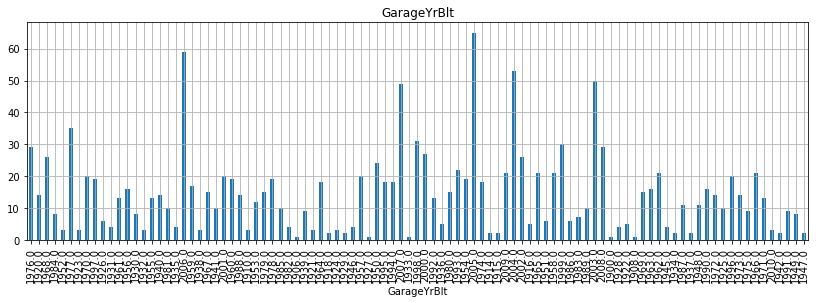
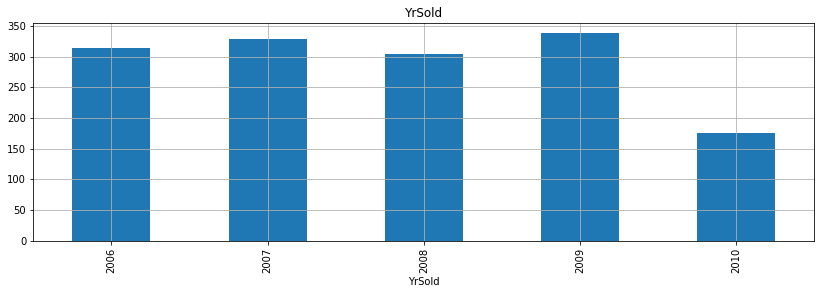
- 위 그래프를 보면서 알 수 있는 것은 무엇일까?
- 우선, 첫 건축 시기는 1872년이고 첫 리모델링 시기는 1950년이고, 마지막으로 첫 차고 건축시기는 1976년으로 확인된다.
- 그리고 매매 시기는 2006-2010년 사이로 집계된 것으로 확인할 수 있다.
(2) SalesPrice와의 관계
- 위 데이터는 각 연도의 특성을 이해하는데는 도움이 될지 모르지만, 결국
Kaggle대회에서 중요한 것은종속변수와의 관계다 - 조금 의미있는 변수를 만들어야 한다. (위 4가지 변수의 조합)
- 보통 실무에서는 이를 도출변수라고 하는데.. 이 부분은
Intermediate level에서 조금 더 자세히 다루기로 한다. - 여기서 강사가 하고자 하는 것은
YrSold에서 그 외 다른 변수와의 연도 시기의 차이를 계산하면 통상적으로 연수가 짧으면 짧을수록 매매가도 올라가고 연수가 길면 길수록 매매가가 하락하는 것을 예상할 수 있다. - 실제 그러한 그래프를 그리도록 해보자.
- 보통 실무에서는 이를 도출변수라고 하는데.. 이 부분은
for fea in year_fea:
    if fea!='YrSold': # `YrSold` 변수는 제외 한다.
        data=train.copy() # 이렇게 해주는 것이 좋다. (원본 데이터는 늘 보존할 수 있다)
        data[fea]=data['YrSold']-data[fea] #  여기가 사실 핵심 포인트다. 연수 차이 계산
        plt.scatter(data[fea], data['SalePrice']) # 산점도 그래프를 그린다.
        plt.title(fea)
        plt.xlabel(fea)
        plt.ylabel('SalePrice')
        plt.show()


- 굳이 회귀선을 그리지 않더라도, 연수의 차이가 작을수록 매매가가 높게 형성된 것을 확인할 수 있다.
V. Review & What’s next
- 처음 프로그래밍을 입문하시는 분들에게
for-loop또는if문법에 대해 고민하지 말 것을 권한다.- 우선
intermediate들어가기전에 그래프의 종류, 기초 문법, 데이터 타입의 종류 등에 대해 한번 정리를 할 것이다.
- 우선
- 오늘 배운 것 중에 가장 중요한 것은 날짜를 다루는 일종의 방법에 대해 배웠는데, 가장 핵심은 연도와 종속변수와의 관계에서 독립변수를 활용하여
도출변수를 활용한EDA를 했다는 점을 다시 한번 상기시킬 필요가 있다. - 다음 시간에는 이제 각 변수의 종류에 대해 조금 더 디테일하게 설명하고자 한다.
- 마찬가지로
numeric_features와categorical_features로 나눠서EDA를 진행한다.
- 마찬가지로
