Ch02 Working with BigQuery
I. Get Started
일단 시작해보자. https://console.cloud.google.com/bigquery

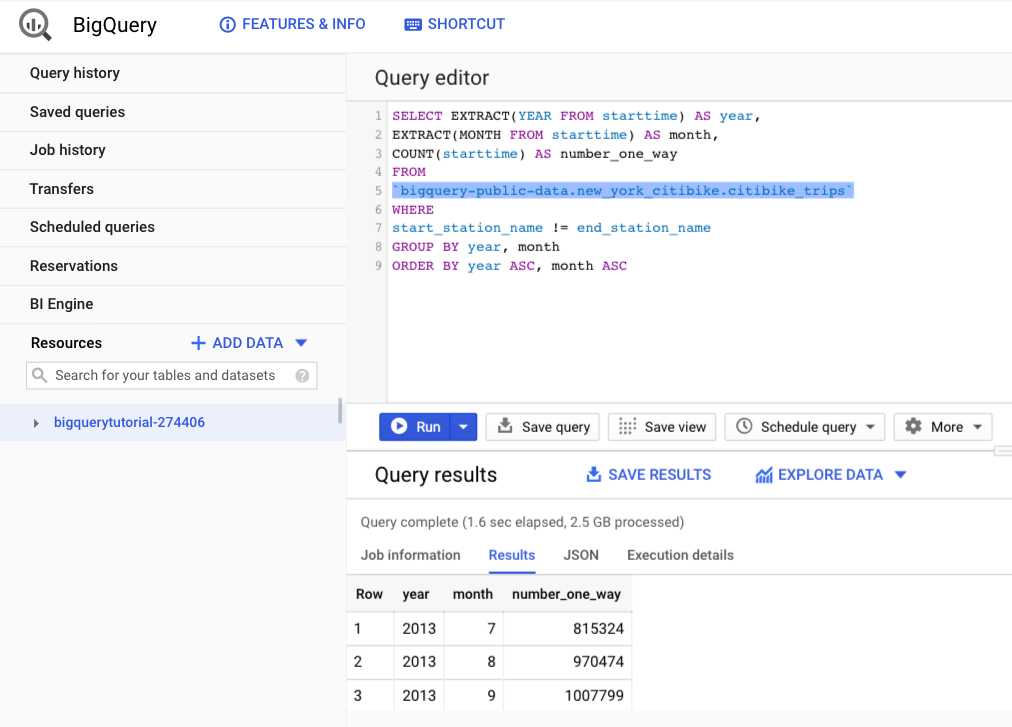
뉴욕주의 자전거 렌탈이 비가 올때와 그렇지 않을 때 수치를 비교하고자 않다. 어떻게 해야할까? 일단, 필요한 데이터는 두가지가 될 것이다. 첫번째는 자전거 렌탈 데이터가 필요하고, 두번째는 뉴욕주의 날씨와 관련된 데이터이다. 두개의 데이터를 조인(join)한 후 수치를 구해야 할 것이다.
위 화면에서 아래 소스코드를 입력한다.
WITH bicycle_rentals AS (
  SELECT
  COUNT(starttime) as num_trips,
  EXTRACT(DATE from starttime) as trip_date
  FROM `bigquery-public-data.new_york_citibike.citibike_trips`
  GROUP BY trip_date
),

rainy_days AS
(
  SELECT
  date,
  (MAX(prcp) > 5) AS rainy
  FROM (
    SELECT wx.date AS date,
    IF (wx.element = 'PRCP', wx.value/10, NULL) AS prcp
    FROM `bigquery-public-data.ghcn_d.ghcnd_2016` AS wx
    WHERE wx.id = 'USW00094728'
)
GROUP BY
  date
)
SELECT
  ROUND(AVG(bk.num_trips)) AS num_trips,
  wx.rainy
FROM bicycle_rentals AS bk
JOIN rainy_days AS wx
ON wx.date = bk.trip_date
GROUP BY wx.rainy
| ROW | num_trips | rainy |
|---|---|---|
| 1 | 39107.0 | false |
| 2 | 32052.0 | true |

일단, 위 SQL문법에 대한 이해는 잠시 미뤄두자. citibike_trips데이터의 용량은 7.47GB이고, ghcnd_2016 데이터의 용량은 1.39GB이다. 그런데, Query 처리 속도는 1.4초만 걸렸다. 만약 이 것을 Local에서 구현한다면 어떻게 될까? 아무리 성능 좋은 MacOS 노트북이라 하더라도 최소 10초이상은 걸릴 것이다. 이러한 속도를 무시해서는 안된다.
위 소스코드를 통해서 얻고자 하는 인사이트(Insight)는 두개의 다른 데이터(new_york_citibike.citibike_trips & data.ghcn_d.ghcnd_2016)가 Join해서 결과를 만들어 내고 있다. 일반적인 MAX(), AVG() 함수를 활용해서 쉽게 데이터를 요약할 수 있다는데 그 장점이 있다.
이것의 장점은 무엇일까? 전사적으로 데이터가 BigQuery에 축적이 되고 있다면, 데이터를 통해서 객관적인 지표를 보다 정확하게 그리고 무엇보다도 빠르게 전달할 수 있다는 점이 있다.
다양한 Interface를 제공하는데, 특히 BigQuery에 적재된 데이터를 구글의 시각화 도구인 Data Studio뿐만 아니라 Tableau, Looker등과 연동할 수 있다는 장점이 있다. 이를 통해서 빠르게 대시보드를 구현할 수도 있다. 물론, R & Python과도 연동이 가능하다.
II. ETL, EL, and ELT로써 기능하는 BigQuery
전통적인 방법으로 Hadoop 에코시스템을 통해서 데이터 추출(Extract), 데이터 가공(Transform), 데이터 로드(Load)의 과정을 지나게 된다. BigQuery는 이러한 데이터파이프 라인의 최종적인 종착지로 기능을 하게된다.
가장 이상적인 방법은 아래 그림과 같다.

조금 쉽게 설명하면 아래와 같다.
- Extract: Cloud Pub/Sub & Cloud Stroage에서 Stream & Batch 스타일로 데이터를 내보낸다.
- Transform: Cloud Dataflow에서 데이터 가공을 한 뒤, Stream & Batch 형태로 데이터를 내보낸다.
- Load: 이렇게 1차 가공된 데이터를 BigQuery에 모두 쌓이는 형태가 된다.
가장 대표적인 예가 Firebase와 빅쿼리의 연동인데, Firebase는 웹/앱 영역을 담당하는데, 여기에서 추출된 모든 데이터가 빅쿼리로 전송되는 형태이다.
EL, ETL, ELT로써 요약하면 아래와 같이 작성이 가능하다.
(1) EL
- Architecture:
- Extract data from files on Google Cloud Storage.
- Load it into BigQuery’s native storage.
- You can trigger this from Cloud Composer, Cloud Functions, or scheduled
- When you’d use it: Batch load of historical data. Scheduled periodic loads of log files(e.g., once a day)
(2) ETL
- Architecture:
- Extract data from Pub/Sub, Google Cloud Storage, Cloud Spanner, Cloud SQL, etc.
- Transform the data using Cloud Dataflow.
- Have Dataflow pipeline write to BigQuery
- When you’d use it: When the raw data needs to be quality controlled, transformed, or enriched before being loaded into BigQuery. When the data loading needs to happen continuously, i.e., if the use case requires streaming. When you want to integrate with continuous integration/continuous delivery (CI/CD) systems and perform unit testing on all
(3) ELT
- Architecture:
- Extract data from files in Google Cloud Storage.
- Store data in close-to-rawformat in BigQuery.
- Transform the data on the fly using BigQuery views.
- When you’d use it: Experimental datasets where you are not yet sure what kinds of transformations are needed to make the data usable. Any production dataset where the transformation can be expressed in SQL.
ETL의 과정도 추후에 예시를 통해서 작성을 할 예정이다. 그 때 다시한번 다루도록 한다.
III. Reference
Lakshmanan, Valliappa,Tigani, Jordan. Google BigQuery: The Definitive Guide (Kindle Location 239). O’Reilly Media. Kindle Edition.
