Streamlit with Bigquery On Compute Engine
Page content
개요
- Streamlit과 Bigquery를 연동하는 코드를 구현한다.
- 가상환경 설정 부터 VS Code 연동까지 준비가 안되어 있다면 이전 글을 참조하기를 바란다.
- 만약 GCP가 처음이신 분들은 이전 글을 순차적으로 읽어본다.
인스턴스 시작
- 인스턴스가 중지가 되어 있다면 다시 시작을 한다.

BigQuery Client 라이브러리 설치
- 클라이언트 라이브러리를 설치한다.
pip install --upgrade google-cloud-bigquery

BigQuery API 설정
- API 및 서비스 > 사용 설정된 API 및 서비스를 클릭한다.

- BigQuery를 검색한다.

- 사용 버튼을 클릭한다.

사용자 인증 정보 만들기
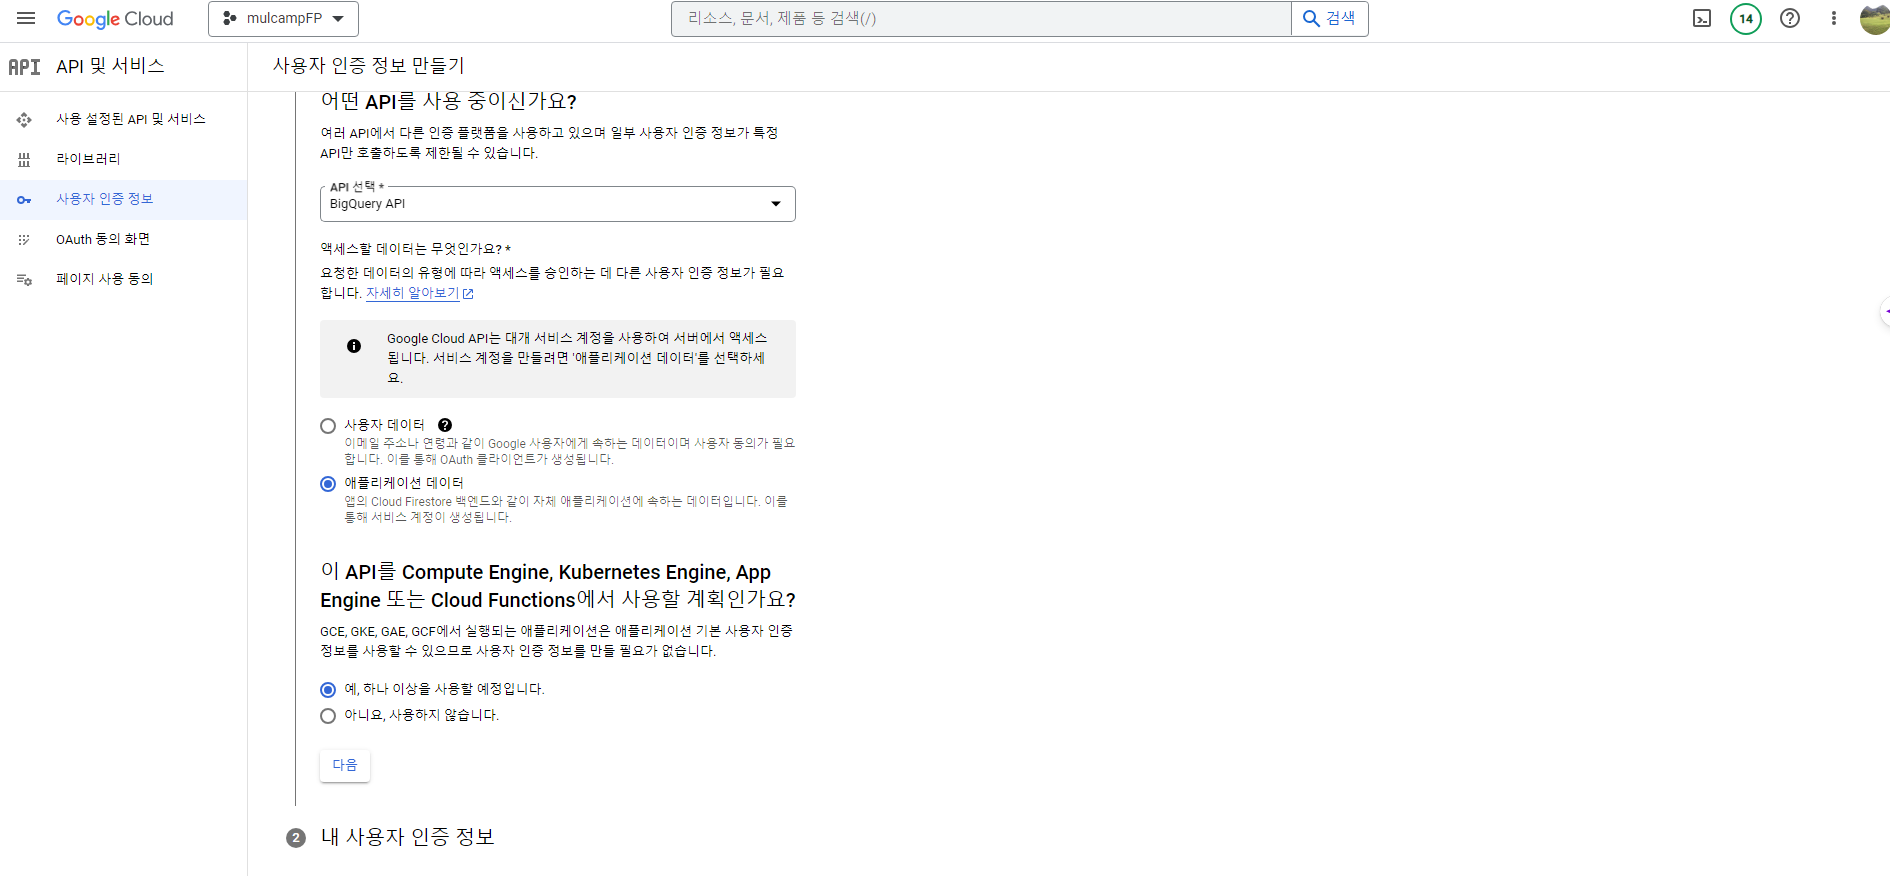
- API 및 서비스 > 사용자 인증 정보를 클릭한다.
- BigQuery API를 지정 후, 다음 버튼을 클릭한다.
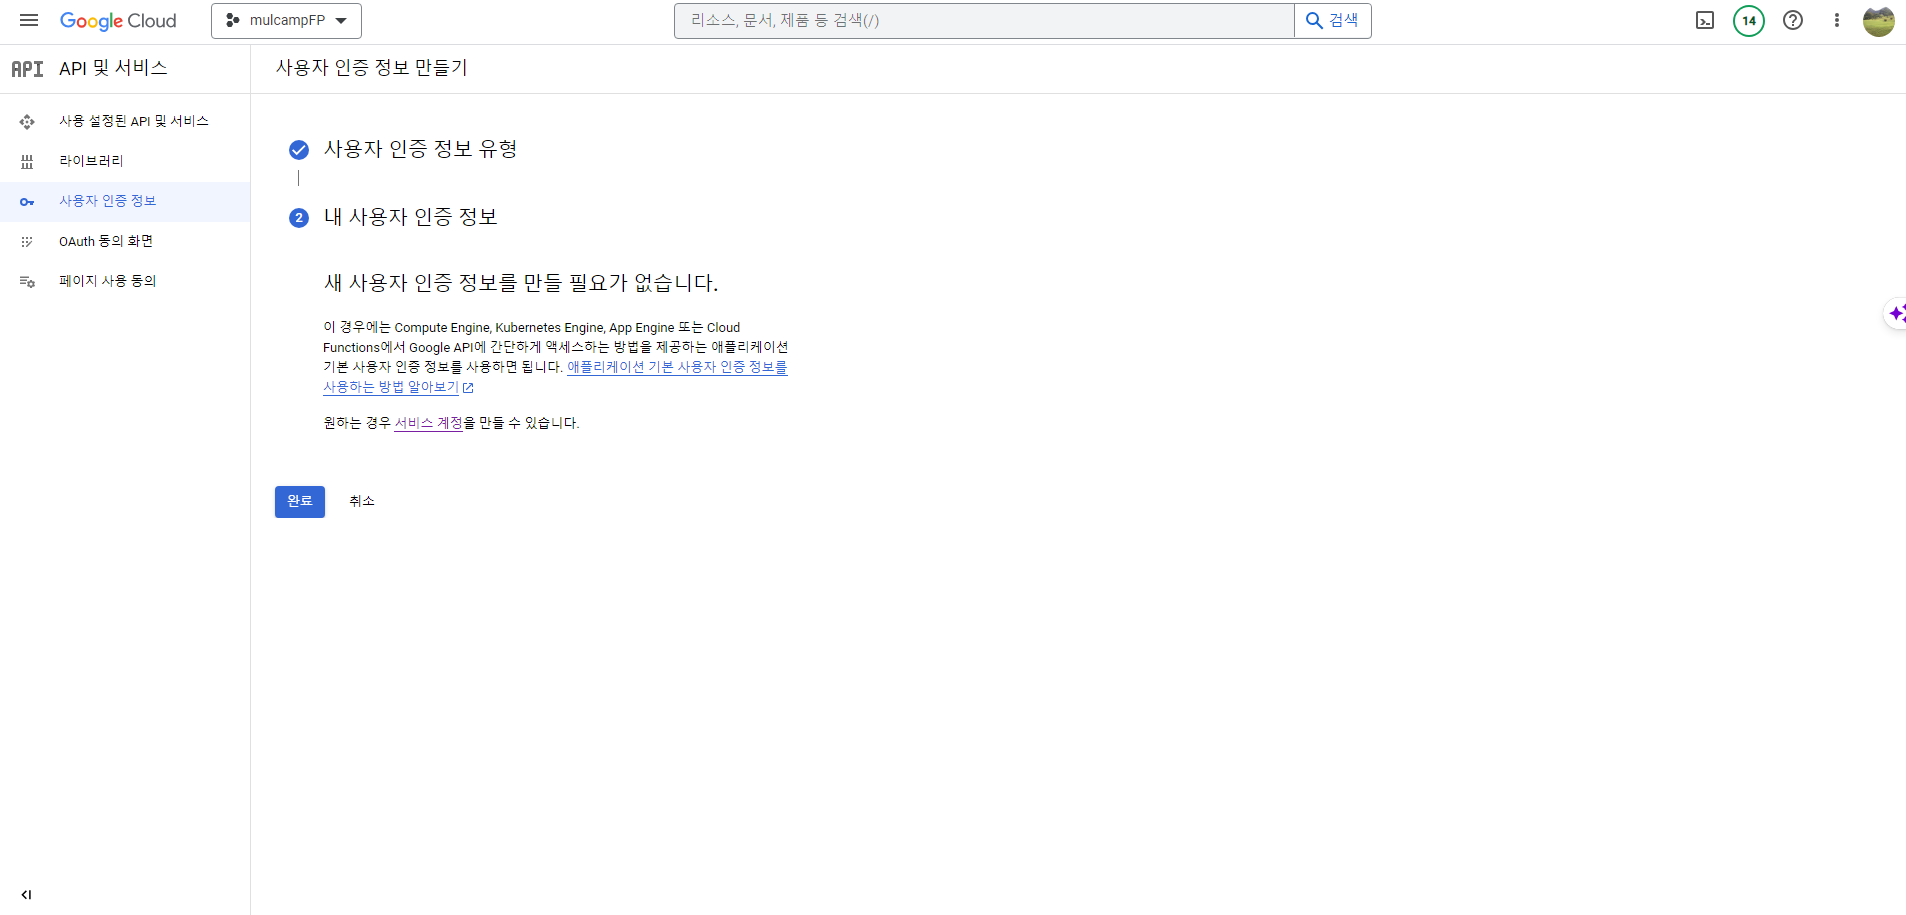
- 애플리케이션 데이터 > 예 버튼을 클릭한다.

서비스 계정 만들기
- Cloud Shell에서 서비스 계정을 만드는 방법을 확인한다.
$ gcloud auth list
Credentialed Accounts
ACTIVE  ACCOUNT
*       123480439173-compute@developer.gserviceaccount.com

To set the active account, run:
    $ gcloud config set account `ACCOUNT`
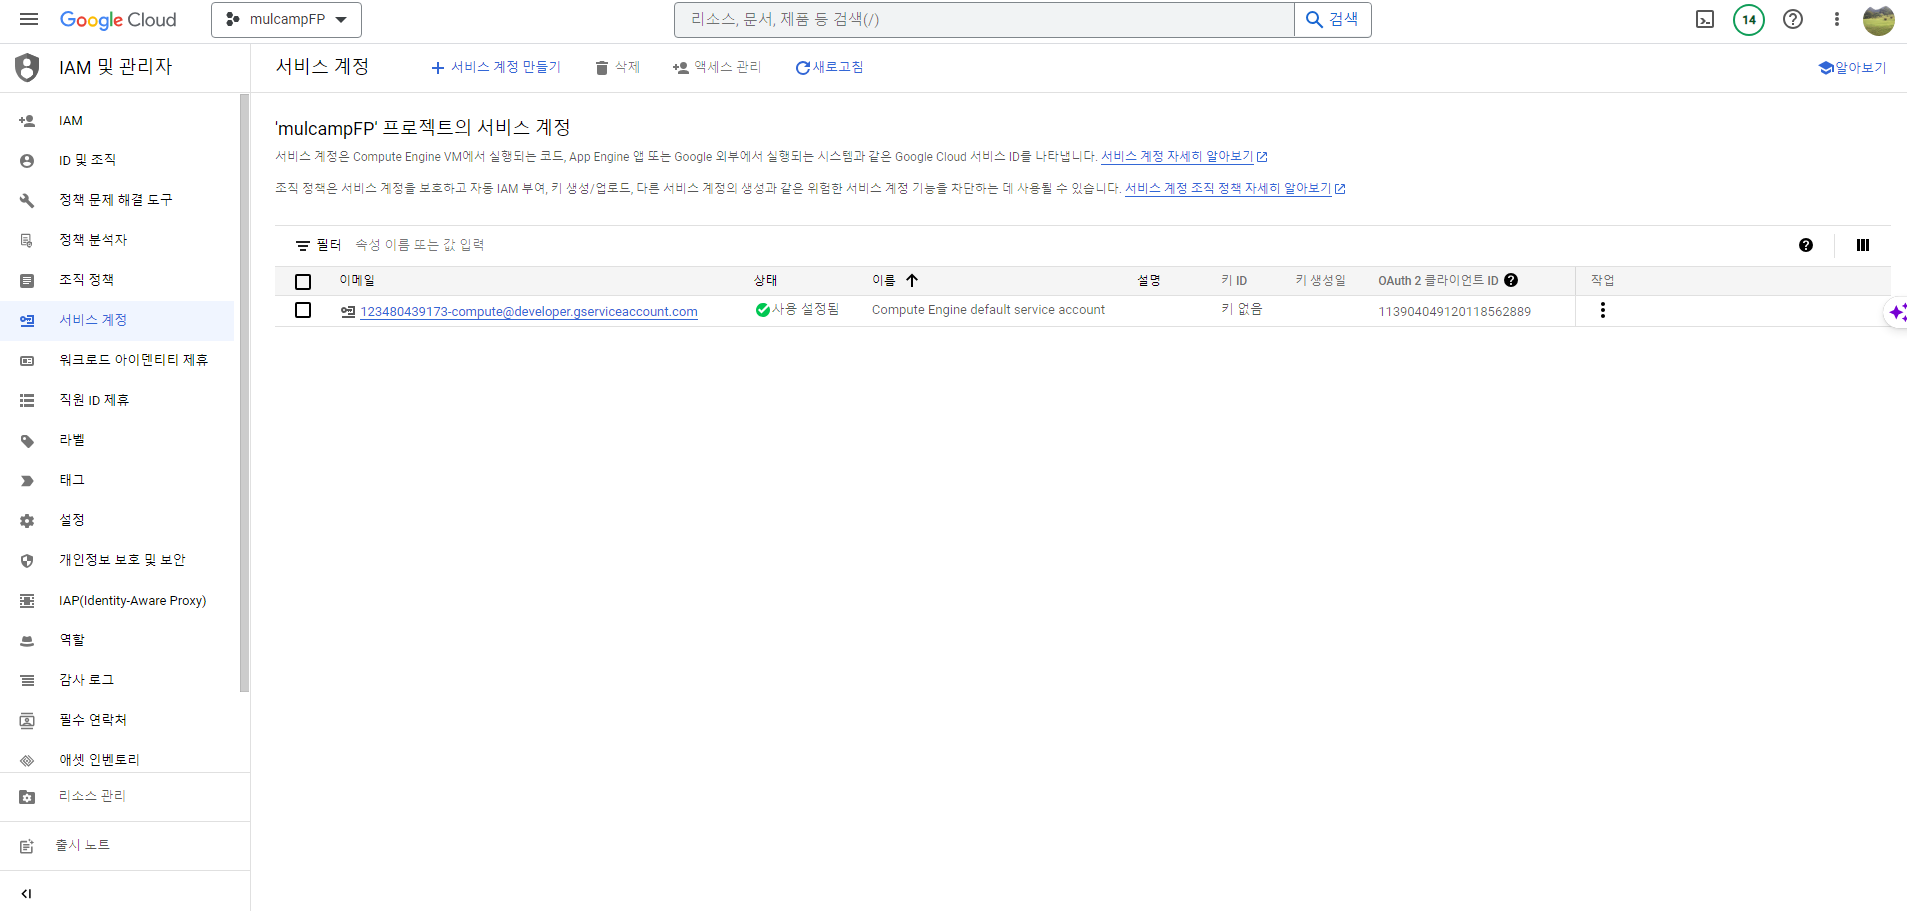
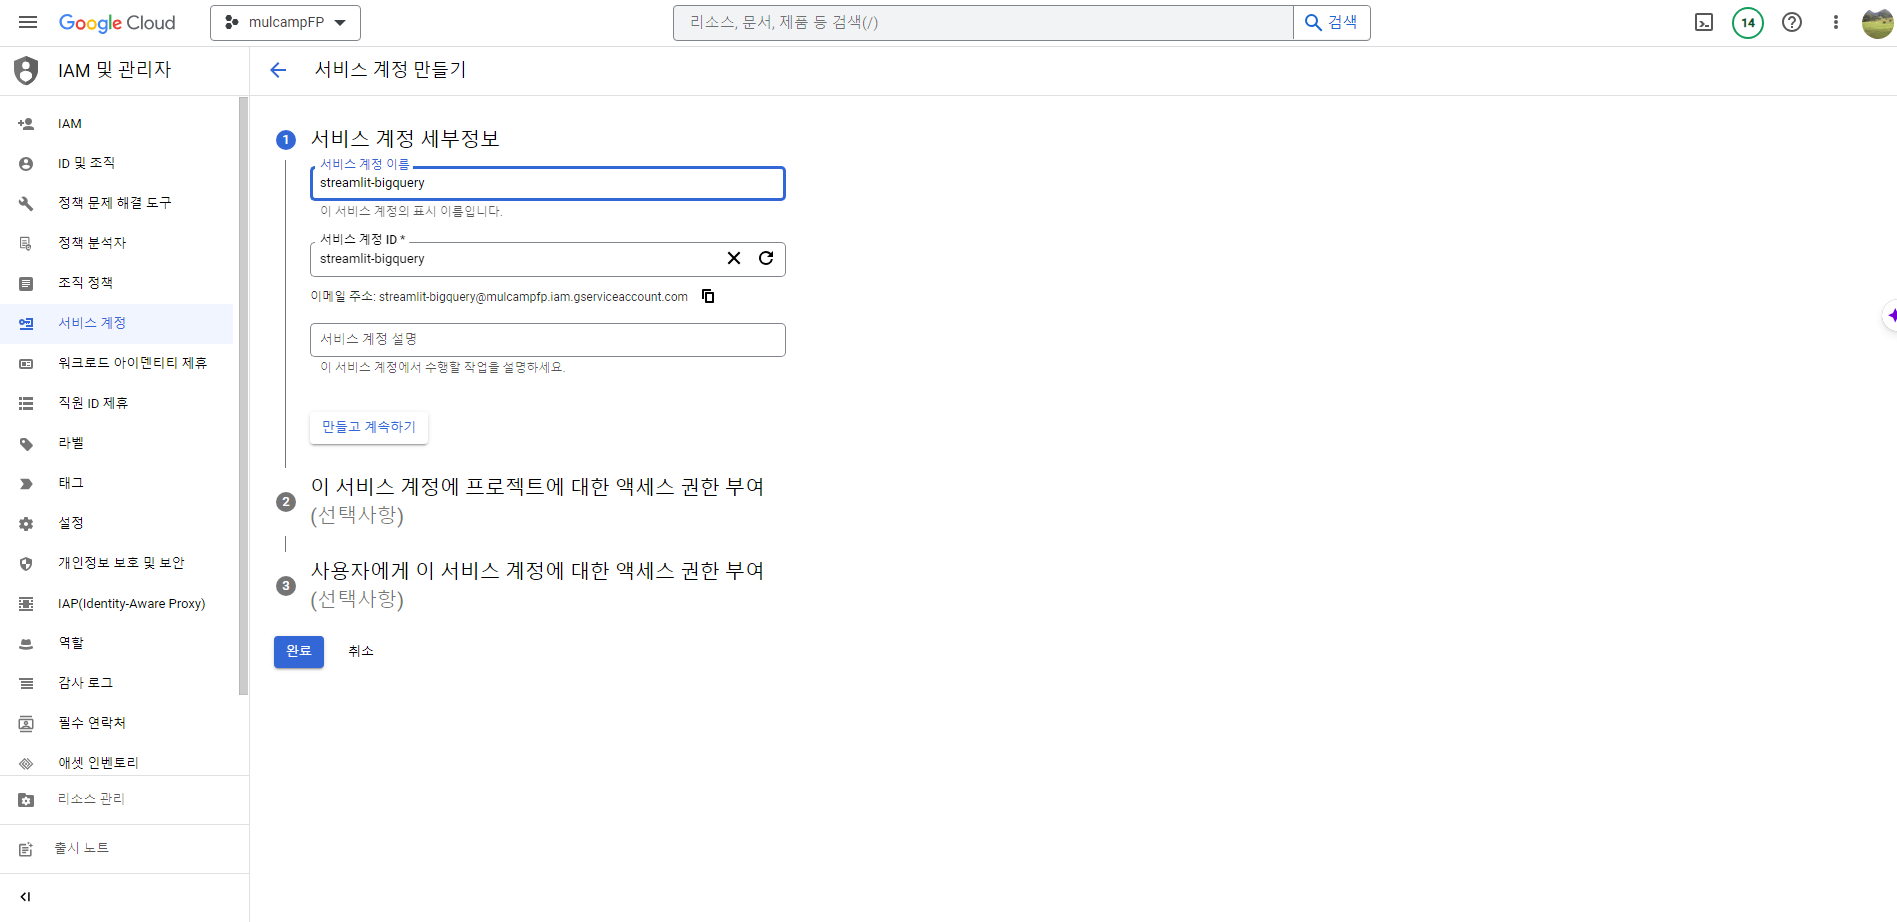
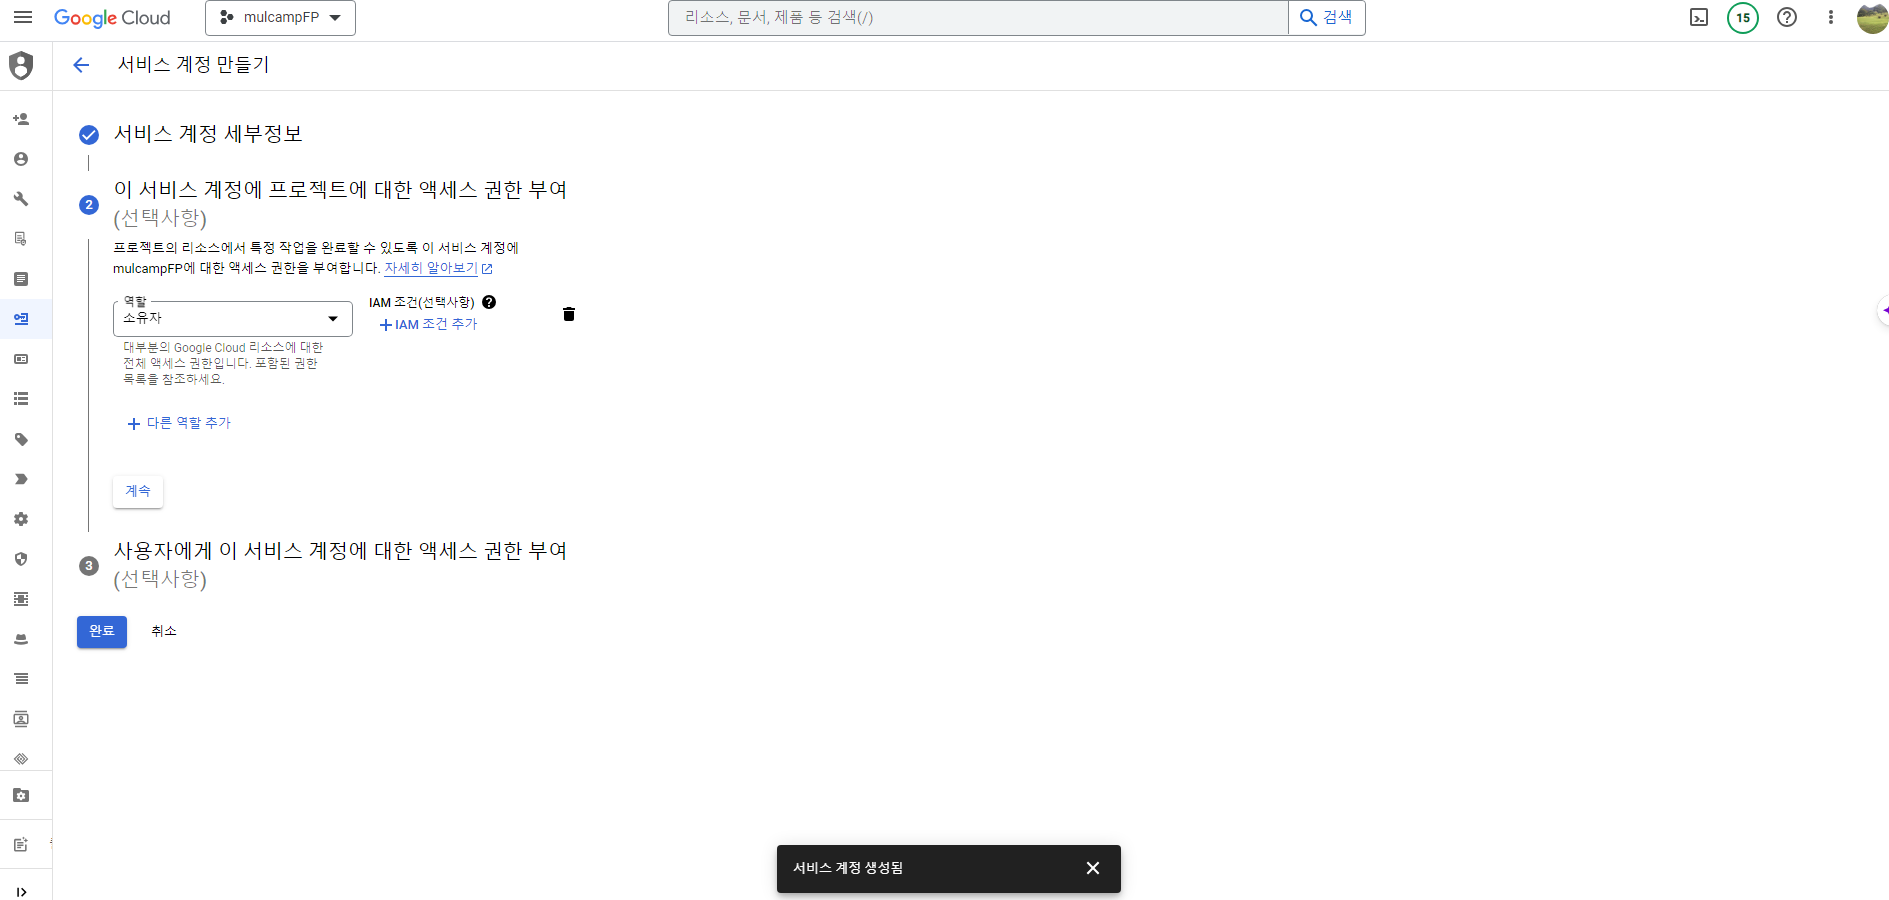
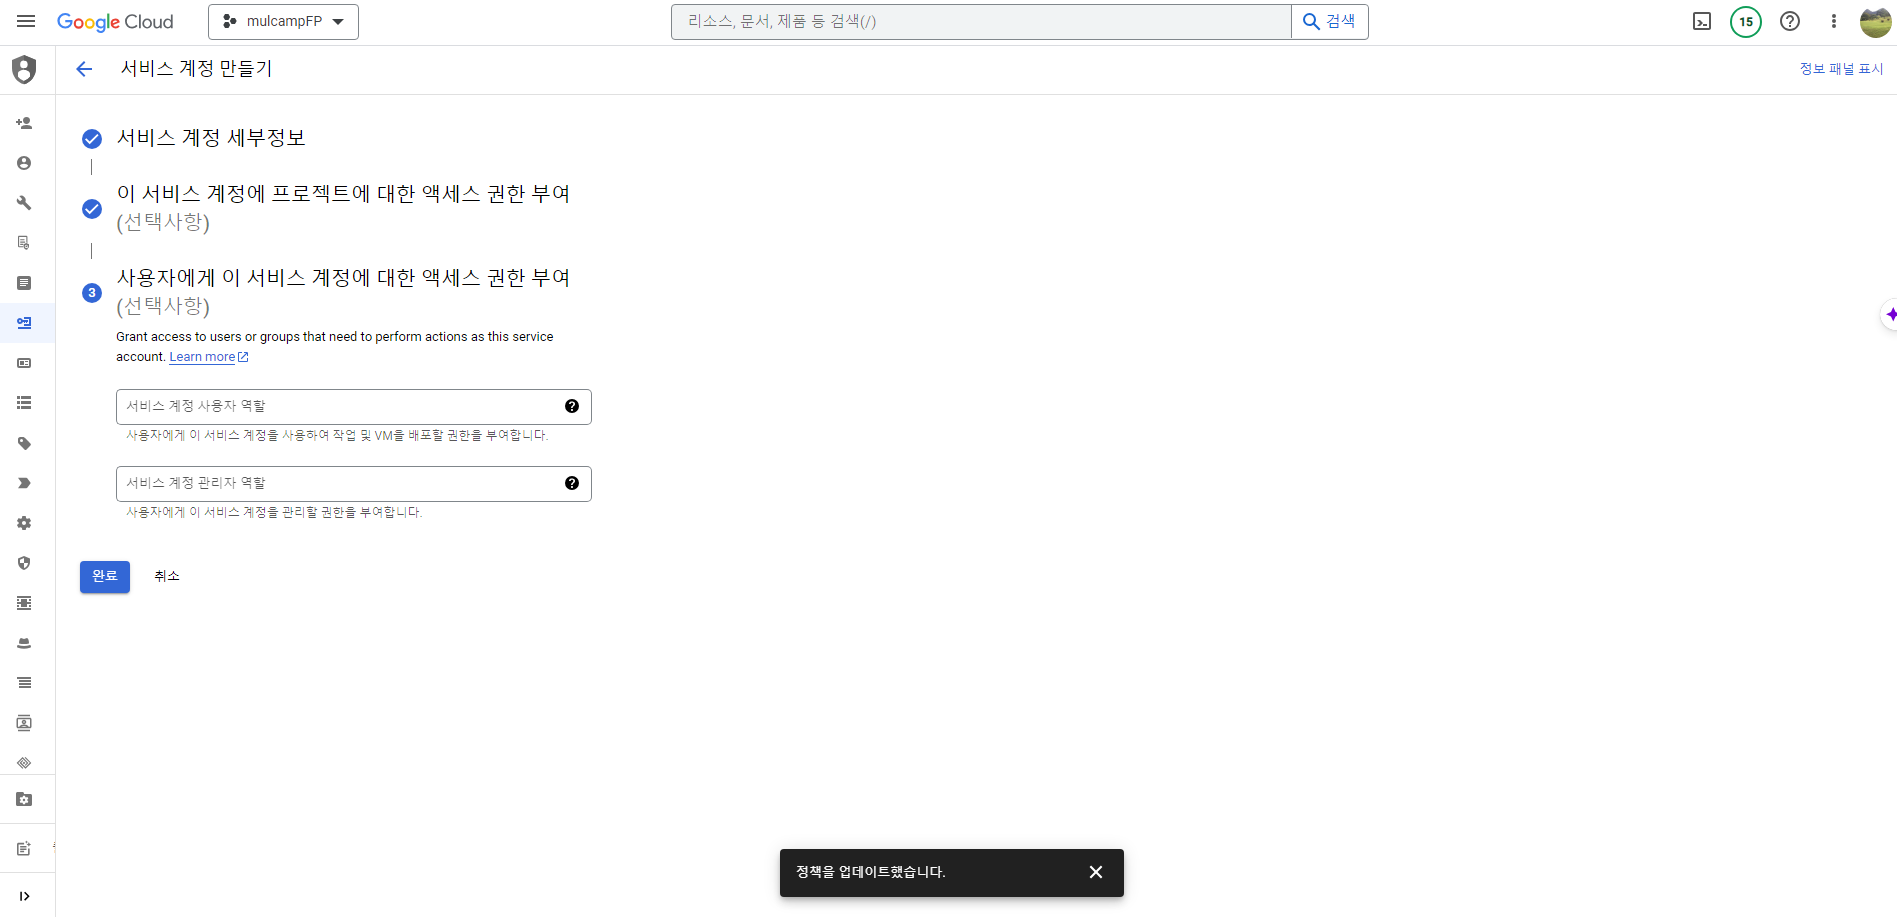
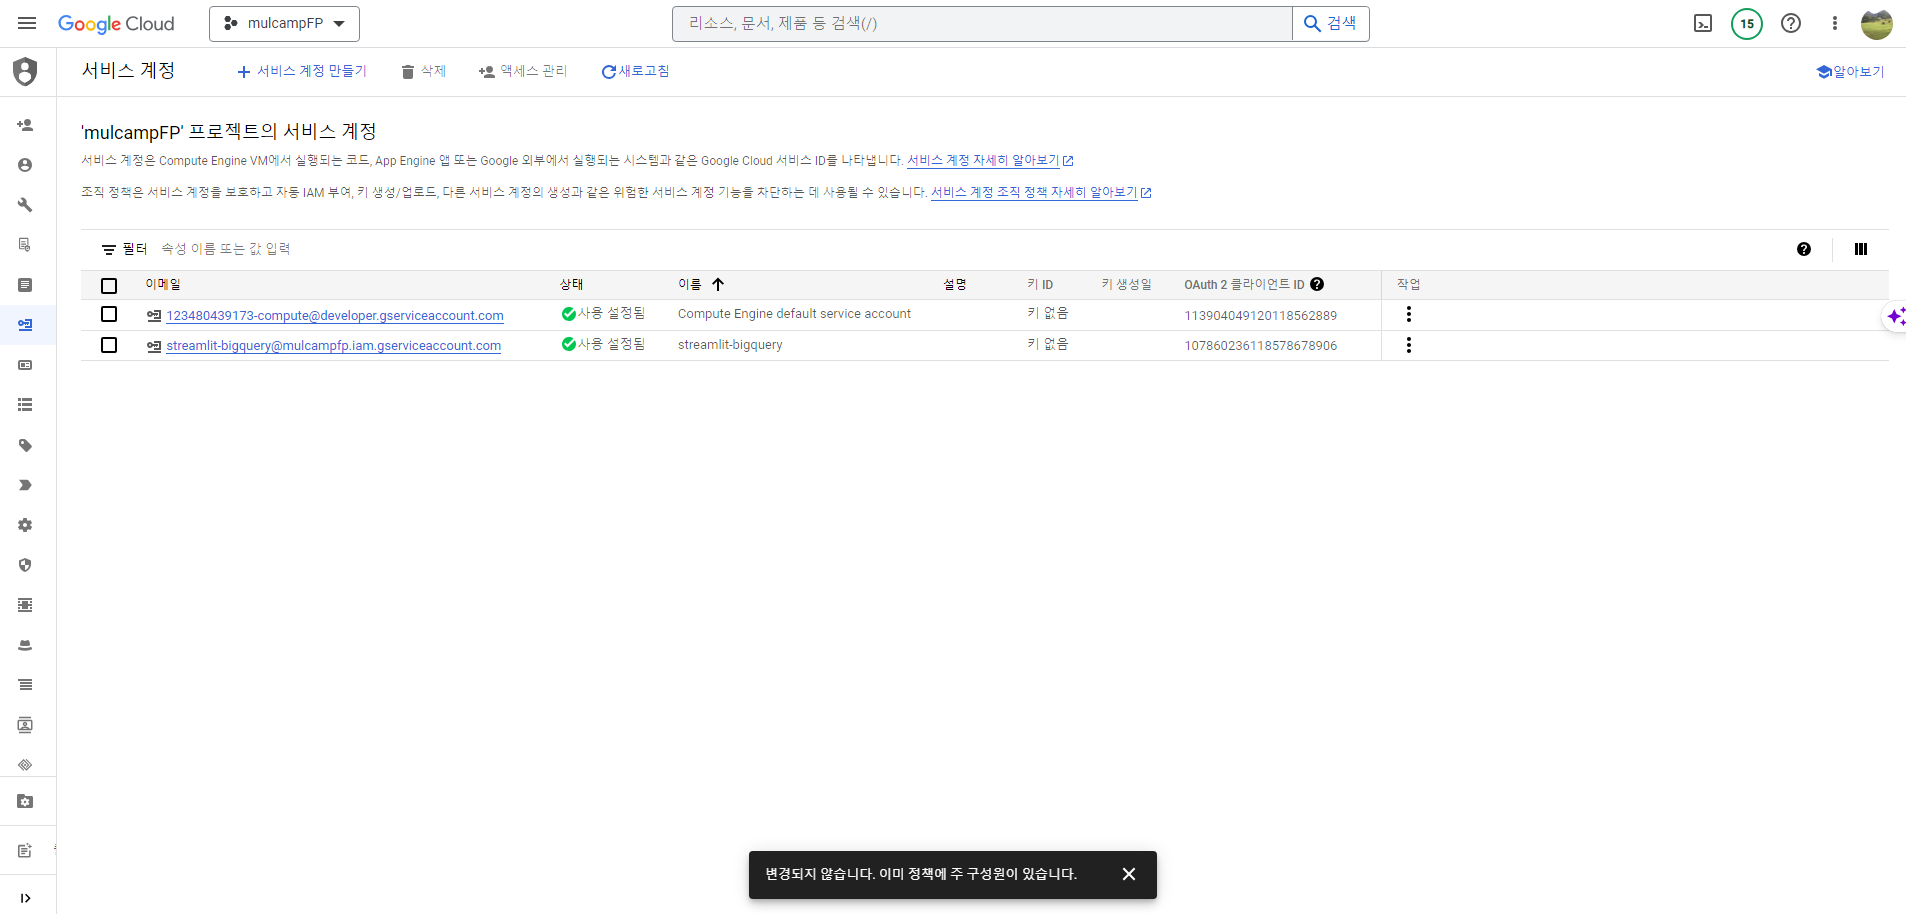
- IAM 및 관리자 > 서비스계정 화면에서 서비스 계정 만들기를 클릭한다.
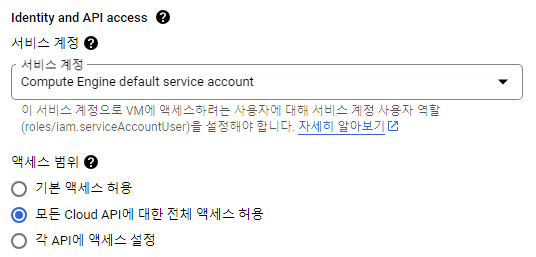
Compute Engine API 및 ID 관리
- Identity and API access 서비스 계정을 모든 Cloud API에 대한 전체 엑세스 허용으로 변경한다.
Sample Code 작성
- 기존 코드를 업데이트 한다.
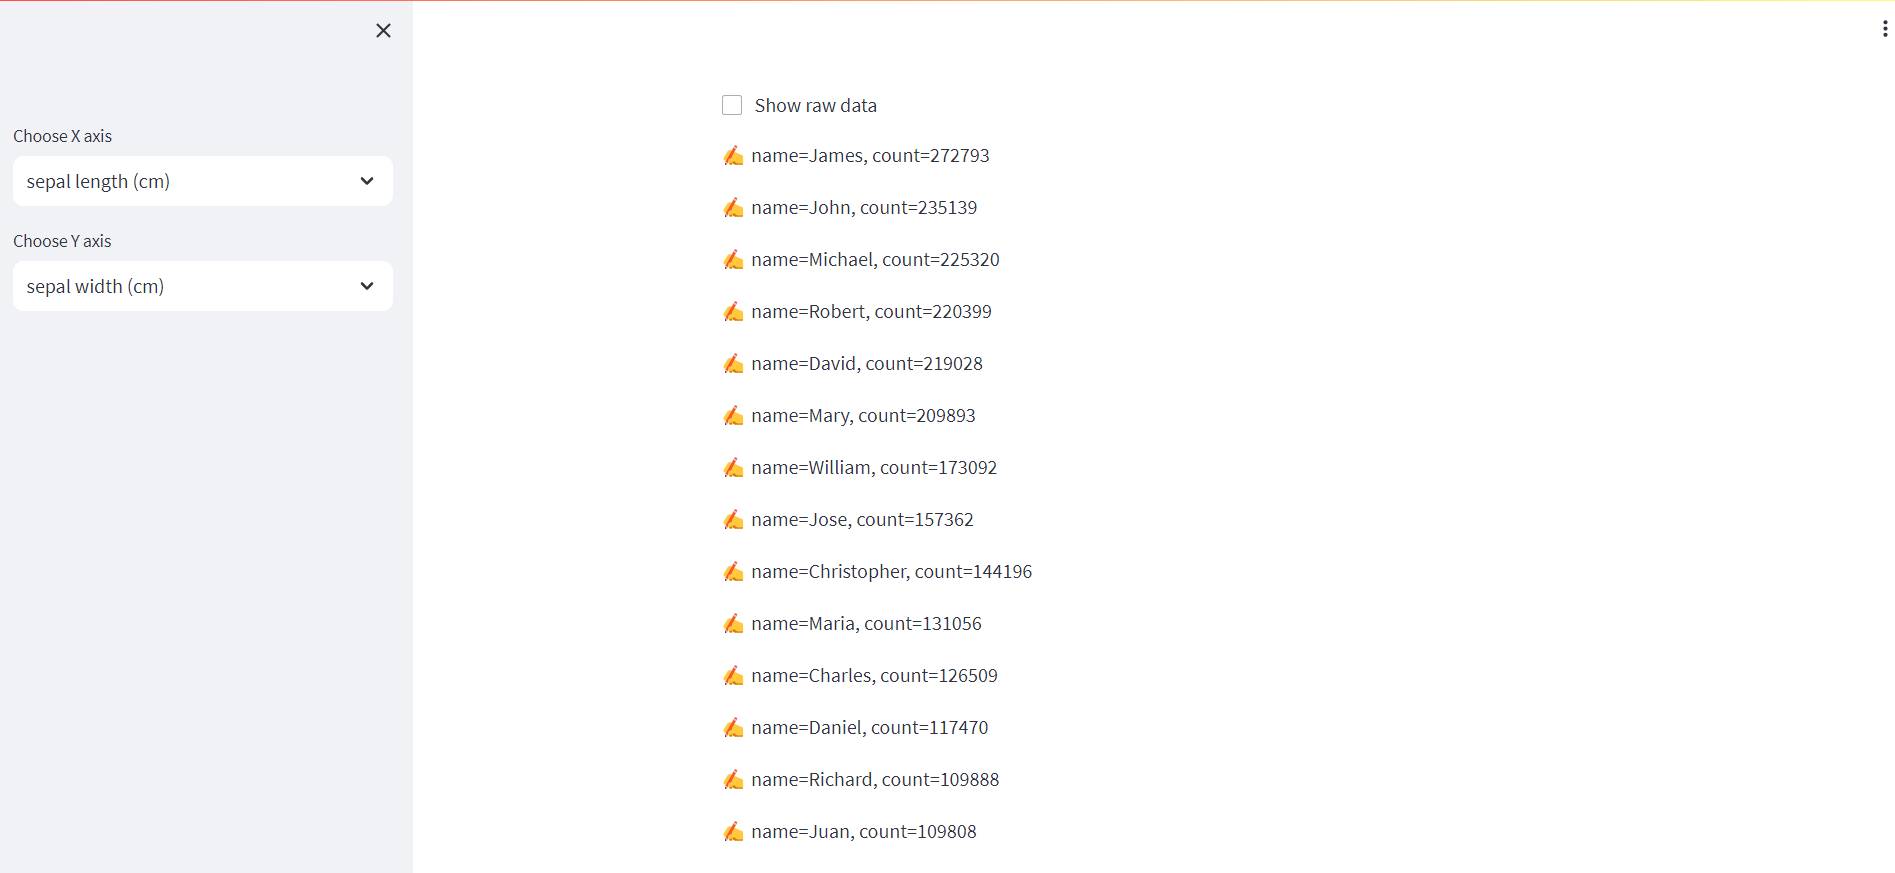
- 추가된 코드는 service_account_email 코드를 추가한 후, 빅쿼리 기본 데이터셋에서 데이터를 가져온 것이다.
# streamlit_app.py

import streamlit as st
import pandas as pd
import numpy as np
import plotly.express as px
from sklearn import datasets
from google.auth import compute_engine
from google.cloud import bigquery
credentials = compute_engine.Credentials(
    service_account_email='YOUR SERVICE ACCOUNT')

client = bigquery.Client(
    project='YOUR PROJECT',
    credentials=credentials)

def load_data():
    iris = datasets.load_iris()
    df = pd.DataFrame(data= np.c_[iris['data'], iris['target']],
                      columns= iris['feature_names'] + ['target'])
    df['species'] = df['target'].map({0: 'setosa', 1: 'versicolor', 2: 'virginica'})
    return df

# Perform query.
# Uses st.cache_data to only rerun when the query changes or after 10 min.
@st.cache_data(ttl=600)
def run_query():
    query = """
        SELECT name, SUM(number) as total_people
        FROM `bigquery-public-data.usa_names.usa_1910_2013`
        WHERE state = 'TX'
        GROUP BY name, state
        ORDER BY total_people DESC
        LIMIT 20
    """
    query_job = client.query(query)  # Make an API request.

    print("The query data:")
    for row in query_job:
        # Row values can be accessed by field name or index.
        st.write("✍️ " + "name={}, count={}".format(row[0], row["total_people"]))

def main():

    df = load_data()
    st.title("Streamlit Iris Data Visualization")

    st.write("""
    ## Explore the Iris dataset
    Use the controls below to explore different visualizations of the Iris dataset.
    """)

    # Sidebar for user controls
    features = df.columns[:-2]  # excluding target and species
    x_axis = st.sidebar.selectbox("Choose X axis", features, index=0)
    y_axis = st.sidebar.selectbox("Choose Y axis", features, index=1)

    # Plotting
    fig = px.scatter(df, x=x_axis, y=y_axis, color='species',
                    title=f"{x_axis} vs. {y_axis} by Species")
    st.plotly_chart(fig)

    # Display raw data on demand
    if st.checkbox("Show raw data", False):  # False means the checkbox is unchecked by default
        st.write(df)
    else:
        run_query()

if __name__ == '__main__':
    main()
