공지
제 수업을 듣는 사람들이 계속적으로 실습할 수 있도록 강의 파일을 만들었습니다. 늘 도움이 되기를 바라며. 참고했던 교재 및 Reference는 꼭 확인하셔서 교재 구매 또는 관련 Reference를 확인하시기를 바랍니다.
이전 포스트인 Colab + Drive + Github Workflow 실전 테스트용으로 생각하면서 읽어주기를 바란다.
I. 개요
- 프로젝트 폴더 내에서 간단하게 EDA를 실습하는 시간을 갖도록 한다.
- 관련 패키지는 우선 다른 곳에서 설치 되었다는 것을 가정한다.
- 본 포스트의 핵심은 환경설정이
Google Colab + Drive내에서 작업하는 것이다.
II. 패키지 불러오기
- 다음과 같은 순서로 실행한다.
- 첫째, 나눔고딕 한글 폰트를 설치한다.
- 둘째, 내부 패키지를 먼저 불러온다.
- 셋째, 런타임을 다시 실행한다.
- 넷째,
Drive 마운트를 진행한다. - 다섯째, 외부 패키지를 불러온다.
(1) 나눔고딕 폰트 불러오기
%config InlineBackend.figure_format = 'retina'
!sudo apt-get -qq -y install fonts-nanum
The following NEW packages will be installed:
  fonts-nanum
0 upgraded, 1 newly installed, 0 to remove and 31 not upgraded.
Need to get 9,604 kB of archives.
After this operation, 29.5 MB of additional disk space will be used.
Selecting previously unselected package fonts-nanum.
(Reading database ... 144433 files and directories currently installed.)
Preparing to unpack .../fonts-nanum_20170925-1_all.deb ...
Unpacking fonts-nanum (20170925-1) ...
Setting up fonts-nanum (20170925-1) ...
Processing triggers for fontconfig (2.12.6-0ubuntu2) ...
(2) 내부에 기 설치된 패키지 불러오기
from datetime import timedelta, datetime
import glob
from itertools import chain
import json
import os
import re

import numpy as np
import pandas as pd

from wordcloud import WordCloud
import nltk
from nltk.corpus import stopwords
from collections import Counter
from sklearn.feature_extraction.text import TfidfVectorizer
from sklearn.feature_extraction.text import CountVectorizer

from pandas.plotting import register_matplotlib_converters
import seaborn as sns
import matplotlib.pyplot as plt
import matplotlib as mpl
import matplotlib.pyplot as plt
import matplotlib.font_manager as fm
fontpath = '/usr/share/fonts/truetype/nanum/NanumBarunGothic.ttf'
font = fm.FontProperties(fname=fontpath, size=9)
plt.rc('font', family='NanumBarunGothic')
plt.rcParams["figure.figsize"] = (20, 10)
register_matplotlib_converters()
mpl.font_manager._rebuild()
mpl.pyplot.rc('font', family='NanumGothic')
fm._rebuild()
(3) 외부 패키지인 konlpy 불러오기
- 다음 코드를 실행하기 전 반드시 [런타임]-[런타임 다시 시작]을 누르자.
# Mount Google Drive
from google.colab import drive # import drive from google colab

ROOT = "/content/drive"     # default location for the drive
print(ROOT)                 # print content of ROOT (Optional)
drive.mount(ROOT)           # we mount the google drive at /content/drive
/content/drive
Drive already mounted at /content/drive; to attempt to forcibly remount, call drive.mount("/content/drive", force_remount=True).
import os, sys
my_path = '/content/notebooks'
os.symlink('/content/drive/My Drive/Colab Notebooks/competition/pkgs_folder', my_path)
sys.path.insert(0,my_path)
from konlpy.tag import Twitter
- 위 코드에서 만약 에러가 나면 처음부터 다시 해야 하니, 유의 바란다.
pd.options.mode.chained_assignment = None
III. 데이터 불러오기
- 이제 깃허브 프로젝트인
competition으로 파일 경로를 변경 한 뒤, 데이터를 불러오도록 한다.
# import join used to join ROOT path and MY_GOOGLE_DRIVE_PATH
from os.path import join

# path to your project on Google Drive
MY_GOOGLE_DRIVE_PATH = 'My Drive/Colab Notebooks/competition'

PROJECT_PATH = join(ROOT, MY_GOOGLE_DRIVE_PATH)
/content/drive/My Drive/Colab Notebooks/competition
On branch master
Your branch is up to date with 'origin/master'.
Changes not staged for commit:
(use "git add/rm <file>..." to update what will be committed)
(use "git checkout -- <file>..." to discard changes in working directory)
�[31mmodified: .gitignore�[m
�[31mdeleted: kakao_arena_3/source/temp.ipynb�[m
�[31mdeleted: kakao_arena_3/source/temp2.ipynb�[m
Untracked files:
(use "git add <file>..." to include in what will be committed)
�[31mkakao_arena_3/source/kakao_arena_3_eda.ipynb�[m
no changes added to commit (use "git add" and/or "git commit -a")
kakao_arena_3 pkgs_folder README.md
# genre_gn_all.json
genre_gn_all = pd.read_json('kakao_arena_3/data/genre_gn_all.json', typ = 'series')
# 장르코드 : gnr_code, 장르명 : gnr_name
genre_gn_all = pd.DataFrame(genre_gn_all, columns = ['gnr_name']).reset_index().rename(columns = {'index' : 'gnr_code'})
print(genre_gn_all.head())
  gnr_code gnr_name
0   GN0100      발라드
1   GN0101   세부장르전체
2   GN0102      '80
3   GN0103      '90
4   GN0104      '00
# 장르코드 뒷자리 두 자리가 00이 아닌 코드를 필터링
dtl_gnr_code = genre_gn_all[genre_gn_all['gnr_code'].str[-2:] != '00']
dtl_gnr_code.rename(columns = {'gnr_code' : 'dtl_gnr_code', 'gnr_name' : 'dtl_gnr_name'}, inplace = True)
print(dtl_gnr_code.head())
  dtl_gnr_code dtl_gnr_name
1       GN0101       세부장르전체
2       GN0102          '80
3       GN0103          '90
4       GN0104          '00
5       GN0105         '10-
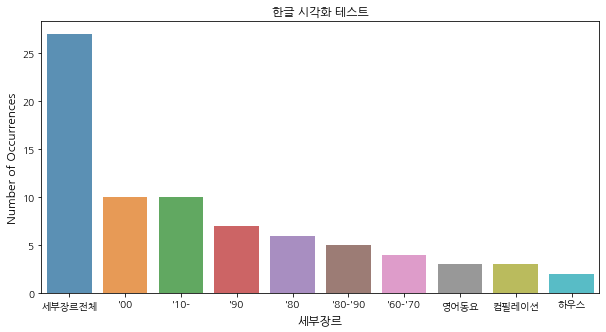
IV. 데이터 시각화 구현
# Plotting a bar graph of the number of stores in each city, for the first ten cities listed
# in the column 'City'
dtl_gnr_name_count  = dtl_gnr_code['dtl_gnr_name'].value_counts()
dtl_gnr_name_count = dtl_gnr_name_count[:10,]
plt.figure(figsize=(10,5))
sns.barplot(dtl_gnr_name_count.index, dtl_gnr_name_count.values, alpha=0.8)
plt.title('한글 시각화 테스트')
plt.ylabel('Number of Occurrences', fontsize=12)
plt.xlabel('세부장르', fontsize=12)
plt.show()