OCE 패키지 소개
Page content
개요
- 새로운 분야에 대한 자료 정리는 언제나 흥미롭다.
- 오늘은 해양과학을 분석해보는 시간을 갖는다.
- 사실 필자는 해양과학을 모른다.
교재
- 교재 Oceanographic Analysis with R는 구매할 수 있다.

패키지 설치
- 패키지 홈페이지를 참고한다.
- 패키지 저자는 CRAN에서 다운로드 받는 것 보다는 깃허브에서 받는 것을 추천한다.
- 패키지 업데이트가 1년에 몇번 되지 않는다고 조금은 솔직하게 말한다.
# install.packages("oce", dependencies = TRUE)
library(oce)
## Loading required package: gsw
## Loading required package: testthat
Evolution of oce
- 홈페이지에서
Oce는 오픈 소스 시스템으로 소개하고 있기 때문에, 관련 학문에 종사하는 사람들이 참여 해주는 것이 해당 패키지 발전에 매우 중요한 부분이다.
그래프
- 간단한 시각화를 구현해보도록 한다.
data(buoy, package = "ocedata")
theta <- (90 - buoy$direction) * pi / 180
u <- -buoy$wind*cos(theta)
v <- -buoy$wind*sin(theta)
s <- c(-1, 1) * max(buoy$wind, na.rm = TRUE)
plot(u, v, xlab = "u [m/s]", ylab = "v [m/s]", xlim=s, ylim=s, asp=1)
for (ring in seq(5, 30, 5))
  lines(ring*cos(seq(0, 2*pi, pi/32)),
        ring*sin(seq(0, 2*pi, pi/32)), col="gray")

- 엘니뇨 그림을 그려본다.
library(WaveletComp)
data(soi, package = "ocedata")
date <- seq(ISOdatetime(soi$year[1], 1, 1, 0, 0, 0, tz = "UTC"),
            length.out = length(soi$year), by = "1 month")

w <- analyze.wavelet(data.frame(date = date, index = soi$index),
                     "index", dt = 1/12, lowerPeriod = 1)
## Smoothing the time series...
## Starting wavelet transformation...
## ... and simulations...
##
  |
  |                                                                      |   0%
  |
  |=                                                                     |   1%
  |
  |===================================================================== |  99%
  |
  |======================================================================| 100%
## Class attributes are accessible through following names:
## series loess.span dt dj Wave Phase Ampl Power Power.avg Power.pval Power.avg.pval Ridge Period Scale nc nr coi.1 coi.2 axis.1 axis.2 date.format date.tz
wt.image(w, plot.ridge = FALSE, siglvl = 0.005, color.key = "i", show.date = TRUE)

- 이번에는 지도 그래프를 그려본다.
library(oce)
par(mar=rep(0.5, 4))
data(endeavour, package = "ocedata")
data("coastlineWorld")
mapPlot(coastlineWorld, type = "l", fill = "gray")
## Warning: In mapPlot() : 'fill' being accepted for backwards compatibility;
## please use 'col' instead
mapPoints(endeavour$longitude, endeavour$latitude, pch = 20, col = 'red')

OCE 객체
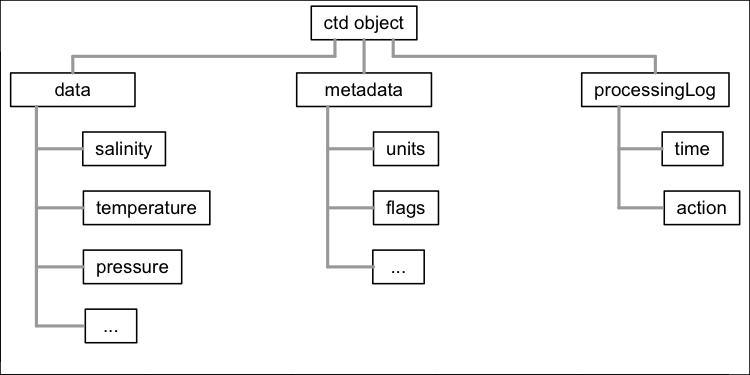
- oce 패키지를 자유롭게 쓰려면, 우선 데이터 객체에 대해 이해를 해야 한다.
- ctd 객체라고 부르는 것 같다.

- ctd 객체라고 부르는 것 같다.
- 위 객체는 크게
data,metadata,processingLog로 구성이 되어 있다.data는 보통 수압, 온도 등의 기록이 저장된다.metadata는 데이터 수집 위치 등이 저장된다.processingLog는 각 객체들이 어떻게 생성되었는지 기록한 로그라고 보면 된다.
OCE 객체 접근 방법
- 홈페이지에 자세한 설명이 나와 있지만 기본적으로 “slot"과 “list” notation을 활용한다 (e.g d@dataset$salinity). 그런데, oce 객체에서는 이러한 접근 방법은 추천하지 않는다.
- 대신에
[[notation 쓰는 방법을 추천한다. - 자세한 내용은 홈페이지를 참고 하자.
요약
- R을 좋아하는 이유중의 하나는 특정 도메인에 맞게 설계된 패키지가 있다는 전문성이며, 패키지에는 반드시 논문 또는 참고할만한 교재를 추천해준다.
- 해양학은 처음 본 분야이지만, 이렇게 쉽게 접근하고 사용할 수 있도록 도와주는 패키지가 있다는 것은 R의 장점이다.
R 강의 소개
- 필자의 강의: 왕초보 데이터 분석 with R
- 쿠폰 유효일은 2021년 10월 30일까지입니다.
- 링크: https://www.udemy.com/course/beginner_with_r/?couponCode=5BF397C9A1E46079627D
- 현재 강의를 계속 찍고 있고, 가격은 한 Section이 끝날 때마다 조금씩 올릴 예정입니다.
Python 강의 소개
- 취준생을 위한 강의를 제작하였습니다.
- 본 블로그를 통해서 강의를 수강하신 분은 게시글 제목과 링크를 수강하여 인프런 메시지를 통해 보내주시기를 바랍니다.
스타벅스 아이스 아메리카노를 선물로 보내드리겠습니다.
- [비전공자 대환영] 제로베이스도 쉽게 입문하는 파이썬 데이터 분석 - 캐글입문기

