Plotly 그래프 - 테마 변경하기
Page content
개요
- plotly 그래프의 테마를 변경하는 방법에 대해 알아본다.
그래프 테마의 종류 확인하기
- 우선 기본 그래프를 확인한다.
import plotly.graph_objects as go
weekly_sales = dict({
    "data": [{
        "type": "bar",
        "x": ["Monday", "Tuesday", "Wednesday", "Thursday", "Friday", "Saturday", "Sunday"],
        "y": [28, 27, 25, 31, 32, 35, 36]
    }],
    "layout" : {"title": {"text": "Sales of the week",
                          "x": 0.5, "font": {"color": "red", "size": 15}}}
})

fig = go.Figure(weekly_sales)
fig.show()

- 그래프 테마를 변경하기 위해 우선 종류를 확인해야 한다.
plotly.io.templates
Templates configuration
-----------------------
    Default template: 'plotly'
    Available templates:
        ['ggplot2', 'seaborn', 'simple_white', 'plotly',
         'plotly_white', 'plotly_dark', 'presentation', 'xgridoff',
         'ygridoff', 'gridon', 'none']
그래프 테마 변경하기
- 그래프 테마를 변경하도록 하기 위해서는 간단하게 아래와 같이 적용하면 된다.
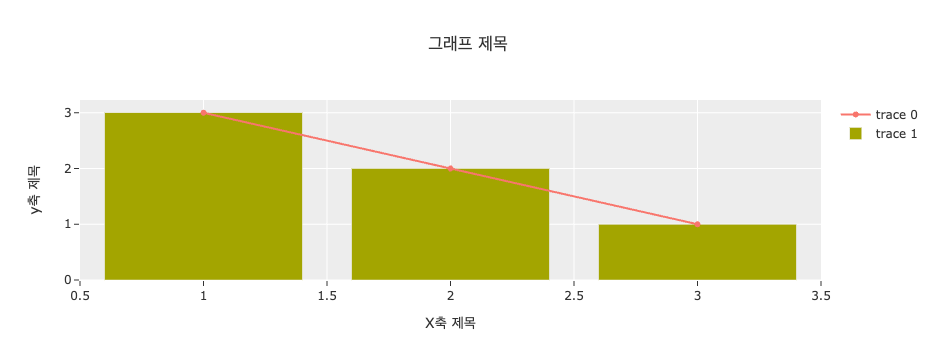
fig.layout.template = 'ggplot2'
fig.show()

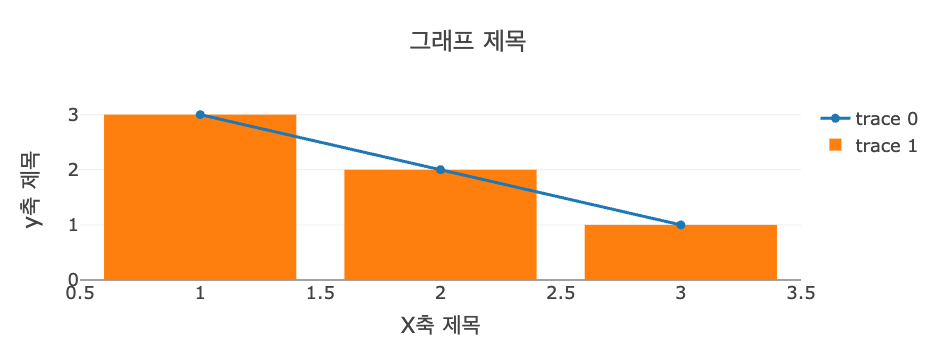
fig.layout.template = 'presentation'
fig.show()

그래프 세부 조정 맛보기
- plotly 외관을 담당하는 모든 부분은
layout영역에서 관리 한다. - 색상 컬러 선택 시, Adobe Color Wheel을 이용하면 보다 더 자세한 색감을 사용할 수 있다.
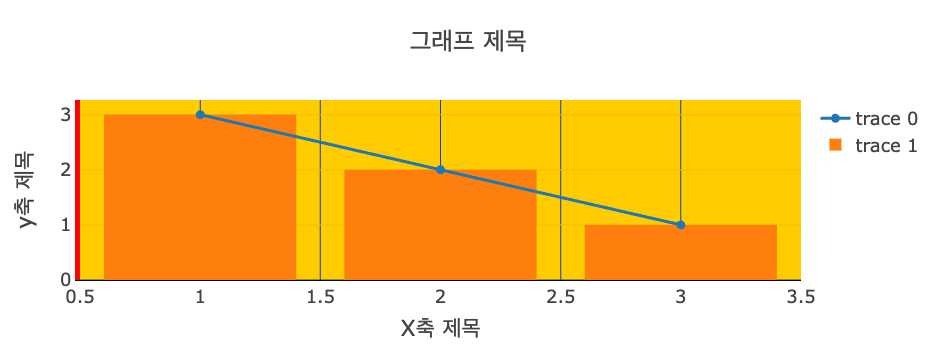
fig.layout.template.layout.plot_bgcolor = '#FFCC00'
fig.layout.xaxis.gridcolor = '#0F3DB8'
fig.layout.xaxis.linecolor = 'black'
fig.layout.yaxis.linecolor = 'red'
fig.layout.yaxis.linewidth = 5
fig.show()

