Python Sales Dashboard Using Dash and Plotly
Page content
개요
- Sales 데이터를 활용하여 대시보드를 만드는 과정을 제작한다.
- 기본 파이썬 코딩은 할 줄 안다는 전제하에 작성하며, 세부 내용이 필요하면 참고 자료를 확인할 것을 권한다.
- 윈도우 10에서 본 프로젝트를 수행하였다.
Chapter 1. Github Repo 생성
- 필자는 Github 레포를 만들었다. (Repo 명: python_dash_sales)
- git clone을 통해서 로컬로 가져온다.
$ git clone https://github.com/your_id/python_dash_sales.git
Chapter 2. Python 프로젝트 생성
-
PyCharm을 주 에디터로 사용할 예정이다.
- 파이썬은 아나콘다로 설치하였고, 이 때 환경변수 설정은 잘 되어 있는지 확인한다.
- 필자는 3.8.8이 기본 버전임을 확인했다.
$ python --version Python 3.8.8 -
git clone한 폴더에서 바로 PyCharm 프로젝트로 열 수 있다.

- 파일을 열면 아래와 같은 화면으로 이동한다.

- 여기에서 가상 환경을 쉽게 설정 할 수 있다.
- 가상환경은 가급적 virtualenv로 하는 것을 추천한다 (특별한 이유는 없다).
- [File] - [Settings] - [Project] - [Python Interpreter] - [설정: 바퀴모양] - [Add]을 순차적으로 클릭한다.

- 아래 화면에서
OK버튼을 클릭하면 된다.

- 설치가 완료가 되면,
venv폴더가 생성이 된 것을 확인할 수 있다.

- 설치가 완료가 된 다음에는 터미널에서
which python을 실행하여 python이 어디에서 실행되는지 확인한다.
$ which python
/c/Users/your_name/Desktop/python_dash_sales/venv/Scripts/python
Chapter 3. 라이브러리 설치
- 라이브러리 설치를 위해서는
requirements.txt파일을 하나 만들고, 아래 라이브러리를 복사하여 붙여 넣는다. (Project ROOT경로에 위치)
ansi2html==1.6.0
anyio==2.2.0
appnope==0.1.2
argon2-cffi==20.1.0
async-generator==1.10
attrs==20.3.0
Babel==2.9.0
backcall==0.2.0
bleach==3.3.0
Brotli==1.0.9
certifi==2020.12.5
cffi==1.14.5
chardet==4.0.0
click==7.1.2
dash==1.19.0
dash-bootstrap-components==0.11.3
dash-core-components==1.15.0
dash-html-components==1.1.2
dash-renderer==1.9.0
dash-table==4.11.2
decorator==4.4.2
defusedxml==0.7.1
entrypoints==0.3
Flask==1.1.2
Flask-Compress==1.9.0
future==0.18.2
gunicorn==20.0.4
idna==2.10
ipykernel==5.5.0
ipython==7.21.0
ipython-genutils==0.2.0
itsdangerous==1.1.0
jedi==0.18.0
Jinja2==2.11.3
joblib==1.0.1
json5==0.9.5
jsonschema==3.2.0
jupyter-client==6.1.12
jupyter-core==4.7.1
jupyter-dash==0.4.0
jupyter-packaging==0.7.12
jupyter-server==1.4.1
jupyterlab==3.0.12
jupyterlab-pygments==0.1.2
jupyterlab-server==2.3.0
MarkupSafe==1.1.1
mistune==0.8.4
nbclassic==0.2.6
nbclient==0.5.3
nbconvert==6.0.7
nbformat==5.1.2
nest-asyncio==1.5.1
notebook==6.2.0
numpy==1.20.1
packaging==20.9
pandas==1.2.3
pandocfilters==1.4.3
parso==0.8.1
pexpect==4.8.0
pickleshare==0.7.5
plotly==4.14.3
prometheus-client==0.9.0
prompt-toolkit==3.0.17
ptyprocess==0.7.0
pycparser==2.20
Pygments==2.8.1
pyparsing==2.4.7
pyrsistent==0.17.3
python-dateutil==2.8.1
pytz==2021.1
pyzmq==22.0.3
requests==2.25.1
retrying==1.3.3
scikit-learn==0.24.1
scipy==1.6.1
Send2Trash==1.5.0
six==1.15.0
sklearn==0.0
sniffio==1.2.0
terminado==0.9.3
testpath==0.4.4
threadpoolctl==2.1.0
tornado==6.1
traitlets==5.0.5
urllib3==1.26.4
wcwidth==0.2.5
webencodings==0.5.1
Werkzeug==1.0.1
xlrd>=1.0.0
- 해당 라이브러리들을 설치한다.
$ pip install -r requirements.txt
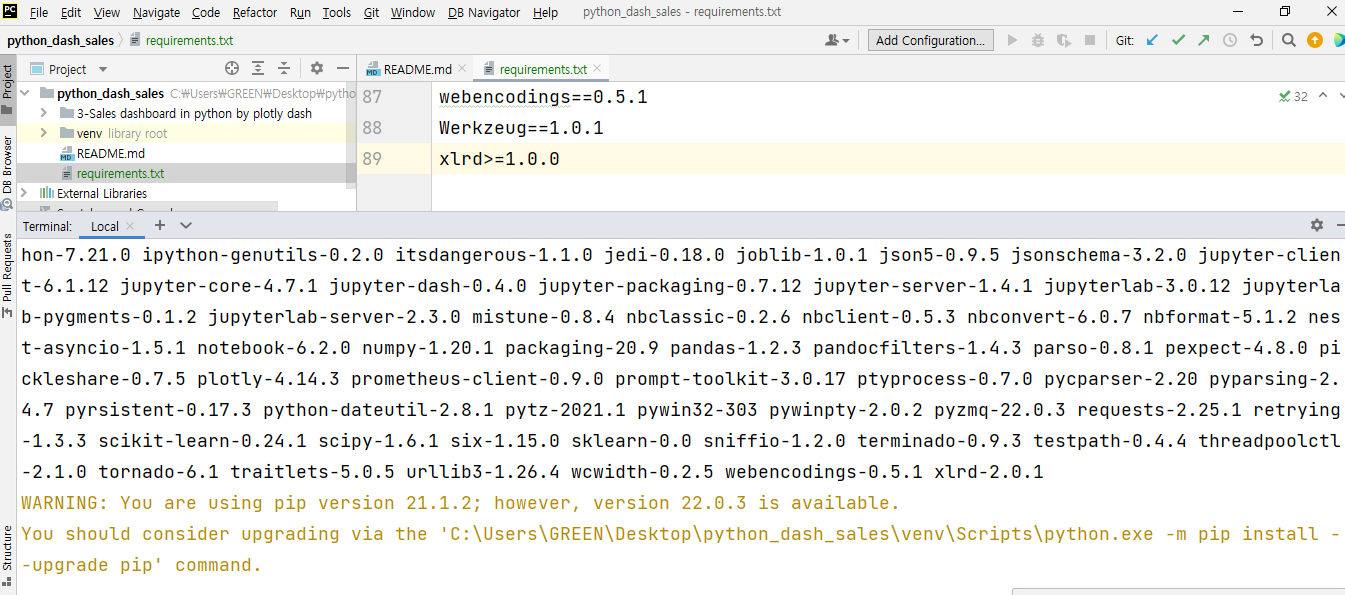
- 아래와 같이 정상적으로 설치가 되면 끝이다.
- 그 외
s1.css와style.css별도로 작성한다. (assets 폴더 아래 위치)- s1.css : https://codepen.io/chriddyp/pen/bWLwgP.css
- style.css
body {
  background-color: #192444;
  margin: 5%;
}

#title1 {
  text-align: center;
}

#title2 {
  text-align: center;
}

#title3 {
  text-align: center;
}

.create_container2 {
  align-items: center;
  border-radius: 15px;
  background-color: #1f2c56;
  margin: 10px;
  padding: 15px;
  position: relative;
  box-shadow: 2px 2px 2px 2px #1f2c56;
}

.dcc_compon {
  margin: 0 auto;
  padding: 5px;
  width: calc(100%-40px);
}

.fix_label {
  font-size: 20px;
  margin: 0 auto;
  padding: 10px;
  padding-bottom: 0px;
  margin-bottom: 0px;
  width: calc(100%-40px);
}

.container-display {
  display: flex;
}

#header {
  align-items: center;
}

.flex-display {
  display: flex;
}

#mainContainer {
  display: flex;
  flex-direction: column;
}

.rc-slider-track {
  background-color: red;
}

.rc-slider-dot-active {
  border-color: red;
  border: solid 2px red;
}

.rc-slider-handle {
  background-color: red;
  border-color: red;
}

.rc.slider-handle:hover {
  border-color: red;
}

.rc.slider-handle-active:active {
  border-color: red;
}

/* width */
::-webkit-scrollbar {
  width: 10px !important;
  display: block !important;
}

/* Track */
::-webkit-scrollbar-track {
  background: #1f2c56 !important;
  border-radius: 10px !important;
  display: block !important;
}

/* Handle */
::-webkit-scrollbar-thumb {
  background: #192444;
}

/* Handle on hover */
::-webkit-scrollbar-thumb:hover {
  background: white !important;
}
- train.csv 파일은 아래 링크에서 다운로드 받는다.
- 링크:
Chapter 4. Dash 코드 작성
- 순차적으로 코드를 작성하도록 한다.
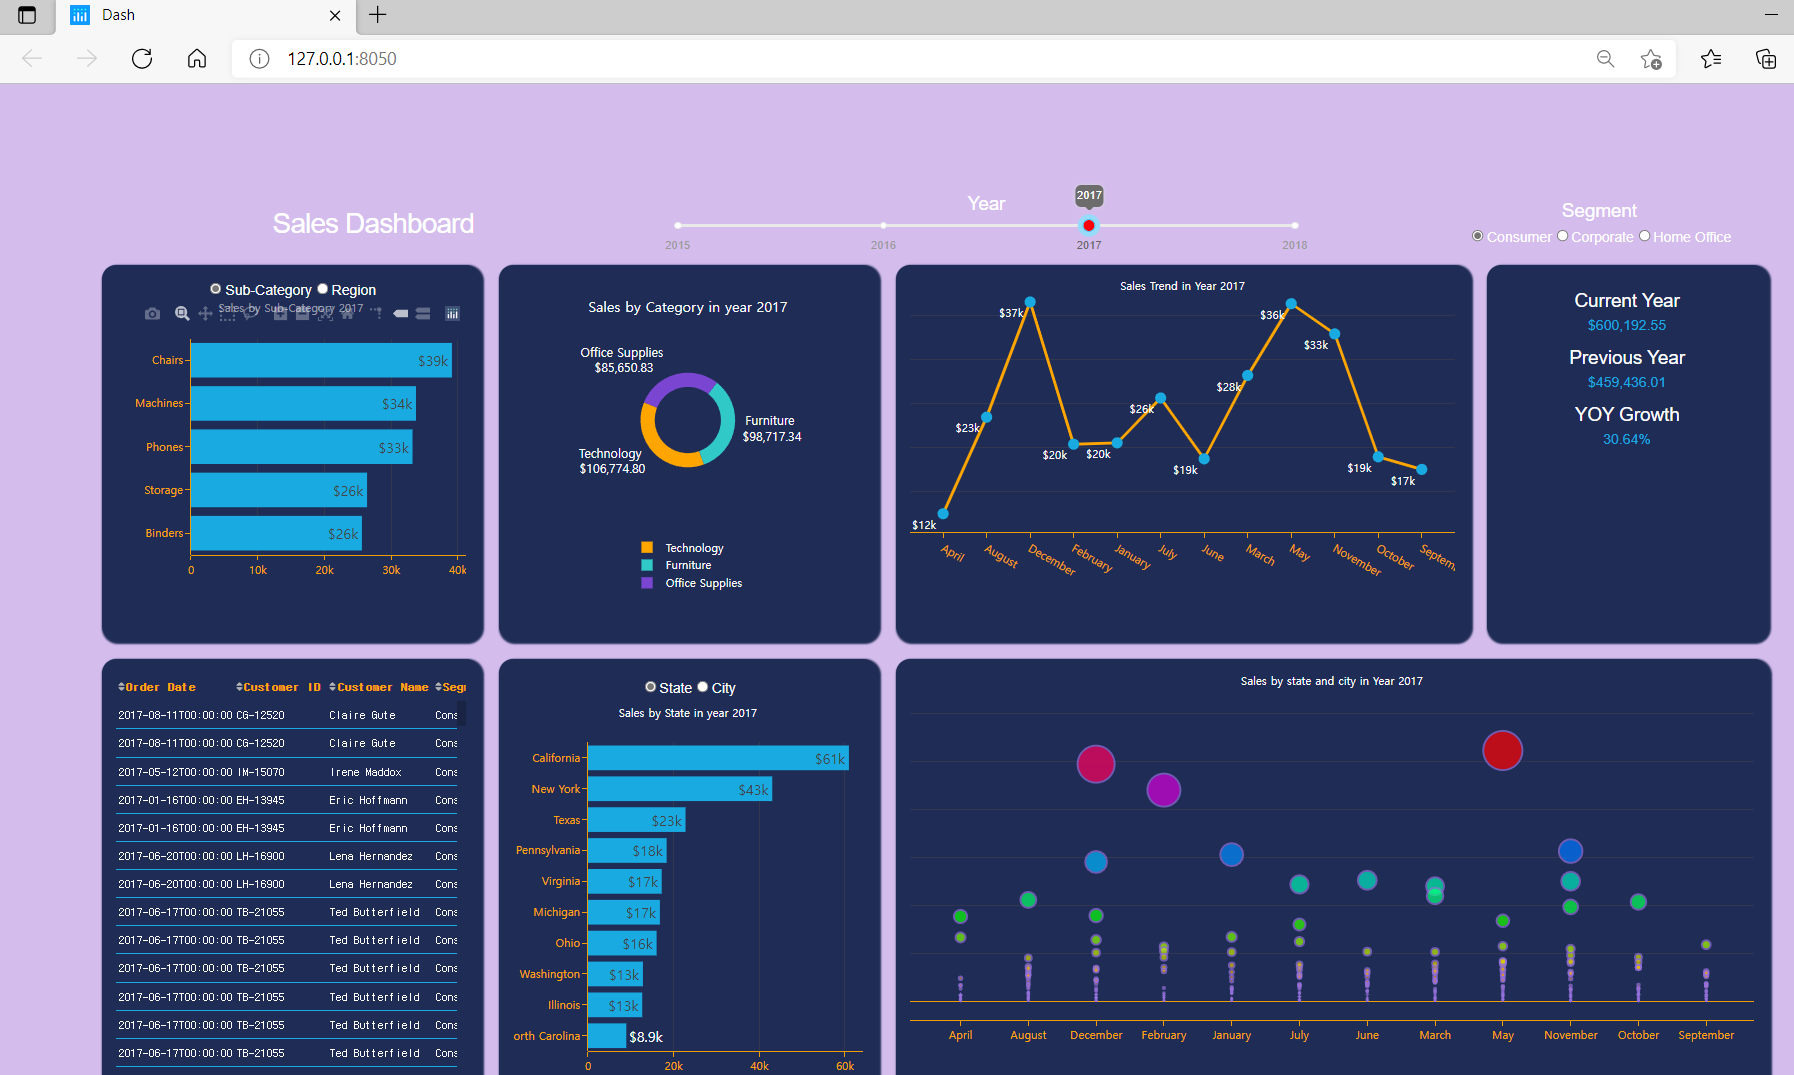
- 완성하려고 하는 대시보드는 다음과 같다.
(1) Dash App Title
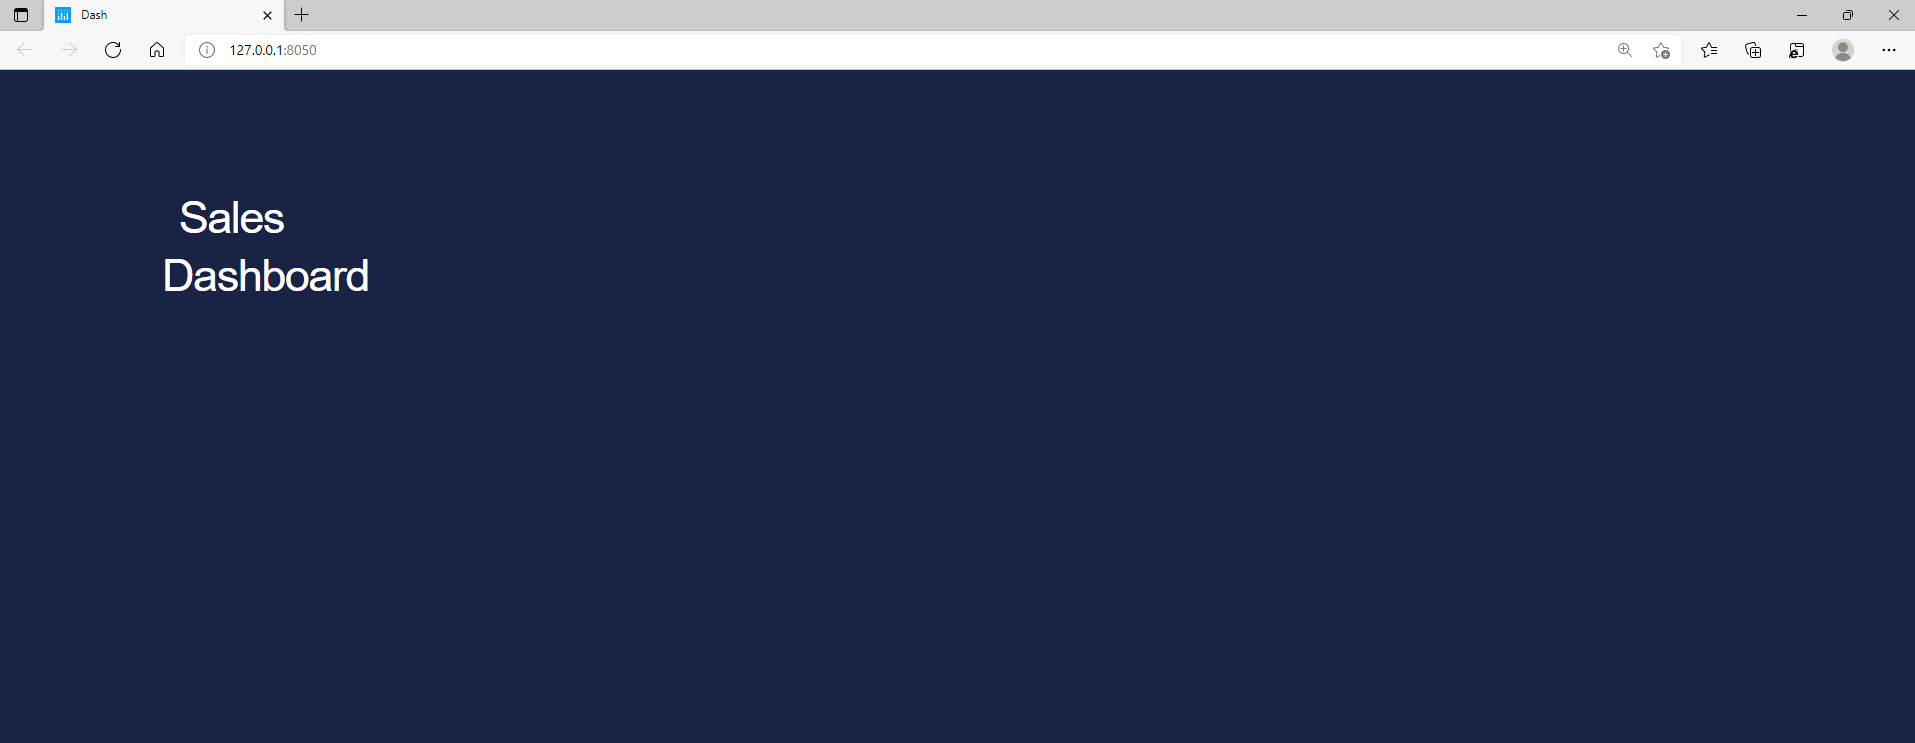
- Title을 추가한 후, 대시보드를 작성한다.
- meta_tags를 추가하면, 모바일 등에도 반응형(interactive) 형태로 화면이 동적으로 바뀐다.
import dash
import dash_html_components as html
import dash_core_components as dcc
from dash.dependencies import Input, Output
import plotly.graph_objects as go
import pandas as pd

sales = pd.read_csv('train.csv')

app = dash.Dash(__name__, meta_tags=[{"name"    : "viewport",
                                      "content" : "width=device-width"}])

app.layout = html.Div([
    html.Div([
        html.Div([
            html.H3("Sales Dashboard",
                    style = {"margin-bottom" : '0px',
                             "color" : "white"})
        ], className="one third column", id = "title1")
    ], id = "header",
       className="row flex-display",
       style = {"margin-bottom" : '0px',
                "color" : "white"})
], id = "mainContainer", style={'display' : "flex", "flex-direction" : "column"})

if __name__ == "__main__":
    app.run_server(debug=True)
- 아래와 같이 실행한다.
$ python index.py
Dash is running on http://127.0.0.1:8050/

 * Serving Flask app "index" (lazy loading)
 * Environment: production
   WARNING: This is a development server. Do not use it in a production deployment.
   Use a production WSGI server instead.
 * Debug mode: on
(2) Slider 기능 추가
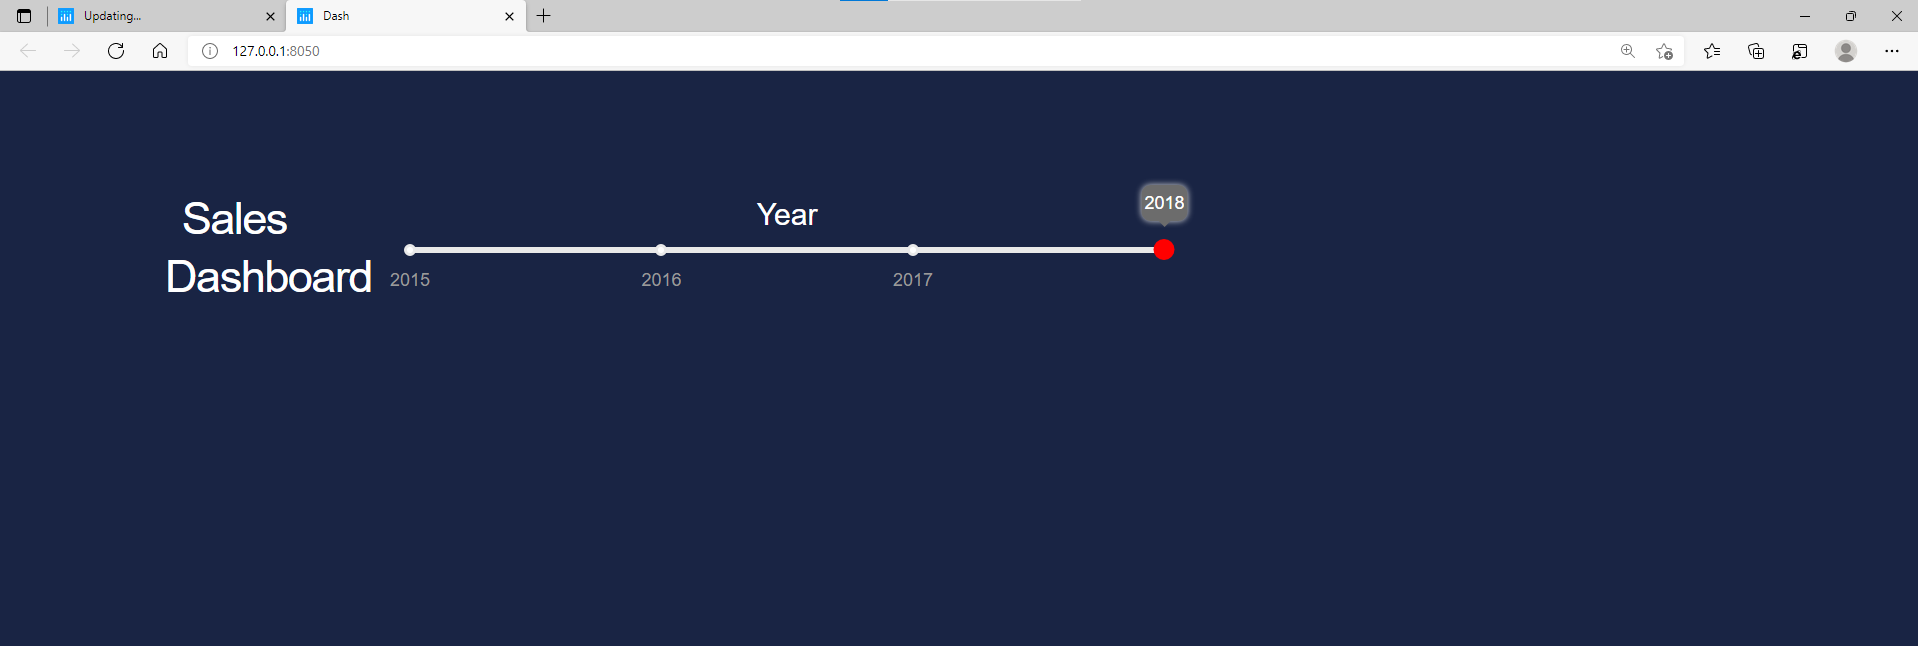
- Slider 기능을 추가하는 코드를 작성한다.
- 코드는
id = titlle1다음에 작성한다. - Slider 참고 자료: https://dash.plotly.com/dash-core-components/slider
- 코드는
app.layout = html.Div([
				...
        ], className="one third column", id = "title1"),

        # slider (2)
        html.Div([
            html.P('Year', className='fix_label', style = {'color' : 'white'}),
            dcc.Slider(     id  = 'select_years',
                            included=False,
                            updatemode='drag',
                            tooltip= {'always_visible': True},
                            min = 2015,
                            max = 2018,
                            step = 1,
                            value = 2018,
                            marks = {str(yr): str(yr) for yr in range(2015, 2018)},
                            className="dcc-compon"), # slider (2)

        ], className="one-half column", id = 'title2')
    ], ...
(3) Radio 버튼 추가
- Radio 버튼 기능을 추가하는 코드를 작성한다.
- 코드는
Slider코드 다음에 이어서 작성한다. - RadioItems 참고 자료: https://dash.plotly.com/dash-core-components/radioitems
- 코드는
app.layout = html.Div([
				...
			], className="one-half column", id = 'title2'), # slider (2)

        # Radio (3) # 작업할 것
        html.Div([
            html.P('Segment', className='fix_label', style={'color': 'white'}),
            dcc.RadioItems(id='radio_items',
                           labelStyle = {'display' : 'inline-block'},
                           value='Consumer',
                           options = [{'label': i, 'value' : i} for i in sales['Segment'].unique()],
                           style={'text-align' : 'center', 'color': 'white'},
                           className="dcc-compon"),
        ], className="one-third column", id='title3')  # Radio (3) # 작업할 것
    ], ...
(4) 가로형 막대 그래프 추가
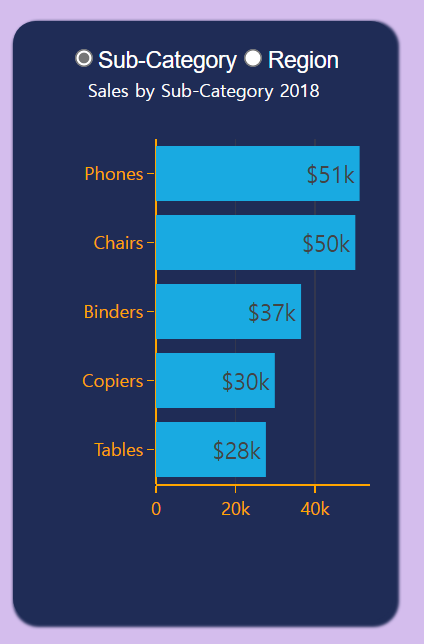
- 지금까지 배운 것을 토대로 다음과 같은 그래프를 추가할 것이다.
- 해당 그래프를 만들기 위해서는 크개 두개의
Component가 필요하다.
app.layout = html.Div([
				...
				], className="one-third column", id='title3')  # Radio (3) # 작업할 것
    ], id = "header", className="row flex-display", style = {"margin-bottom" : '0px', "color" : "white"}),

    html.Div([
				# (4) 가로형 막대 그래프
        html.Div([
            dcc.RadioItems(id='radio_items1',
                           labelStyle={'display': 'inline-block'},
                           value='Sub-Category',
                           options=[{'label': 'Sub-Category', 'value': 'Sub-Category'},
                                    {'label': 'Region', 'value' : 'Region'}],
                           style={'text-align': 'center', 'color': 'white'},
                           className="dcc-compon"),

            dcc.Graph(id = 'bar_chart_1', config={'displayModeBar' : 'hover'}, style={'height': '350px'})
        ], className='create_container2 three columns', style={'height' : '400px'})
    ], className='row flex-display')
], id = "mainContainer", style={'display' : "flex", "flex-direction" : "column"}) # app.layout = html.Div
- 그다음 중요한 것이 Callback 사용이다.
- Callback에 관한 기본 튜토리얼은 다음 링크를 참조한다.
- 참조: https://dash.plotly.com/basic-callbacks
- 그래프 작성 시, 고려할 사항은 크게 두가지다.
- 독립변수에 해당하는 컬럼은 크게 Sub-Category & Region으로 구분된다.
- 해당 구문은 조건문으로 작성을 하도록 한다.
- 먼저, Year, Column이 존재하지 않기 때문에, 해당 코드를 생성하는 코드를 작성한다.
...

sales = pd.read_csv('train.csv')
sales['Order Date'] = pd.to_datetime(sales['Order Date'])
sales['Year'] = sales['Order Date'].dt.year
sales['Month'] = sales['Order Date'].dt.month_name()

...
- 다음은 Callback 영역을 작성하는 코드이다. 코드에 관한 구체적인 설명은 생략한다.
# 그래프 작성 구간 (Callback), # (4) 가로형 막대 그래프
@app.callback(Output('bar_chart_1', 'figure'),
              [Input('select_years', 'value')],
              [Input('radio_items', 'value')],
              [Input('radio_items1', 'value')])
def update_graph(select_years, radio_items, radio_items1):
    sales1 = sales.groupby(['Year', 'Sub-Category', 'Segment'])['Sales'].sum().reset_index()
    sales2 = sales1[(sales1['Year'] == select_years) & (sales1['Segment'] == radio_items)].\
        sort_values(by = ['Sales'], ascending=True).nlargest(5, columns = ['Sales'])
    sales3 = sales.groupby(['Year', 'Region', 'Segment'])['Sales'].sum().reset_index()
    sales4 = sales3[(sales3['Year'] == select_years) & (sales3['Segment'] == radio_items)].sort_values(by=['Sales'],ascending=False)

    if radio_items1 == 'Sub-Category':
        return {
            'data': [
                go.Bar(
                    x    = sales2['Sales'],
                    y    = sales2['Sub-Category'],
                    text = sales2['Sales'],
                    texttemplate ='$' + '%{text:,.2s}',
                    textposition ='auto',
                    orientation  ='h',
                    marker=dict(color='#19AAE1'),
                    hoverinfo='text',
                    hovertext=
                    '<b>Year</b>: ' + sales2['Year'].astype(str) + '<br>' +
                    '<b>Segment</b>: ' + sales2['Segment'].astype(str) + '<br>' +
                    '<b>Sub-Category</b>: ' + sales2['Sub-Category'].astype(str) + '<br>' +
                    '<b>Sales</b>: $' + [f'{x:,.0f}' for x in sales2['Sales']] + '<br>'

                ),
            ], # data
        'layout': go.Layout(
            title={'text': 'Sales by Sub-Category' + ' ' + str((select_years)),
                   'y': 0.99,
                   'x': 0.5,
                   'xanchor': 'center',
                   'yanchor': 'top'},
            titlefont={'color': 'white',
                       'size': 12},
            font=dict(family='sans-serif',
                      color='white',
                      size=15),
            hovermode='closest',
            paper_bgcolor='#1f2c56',
            plot_bgcolor='#1f2c56',
            legend={'orientation': 'h',
                    'bgcolor': '#010915',
                    'xanchor': 'center', 'x': 0.5, 'y': -0.7},
            margin=dict(t=40, r=0),
            xaxis=dict(title='<b></b>',
                       color='orange',
                       showline=True,
                       showgrid=True,
                       showticklabels=True,
                       linecolor='orange',
                       linewidth=1,
                       ticks='outside',
                       tickfont=dict(
                           family='Aerial',
                           color='orange',
                           size=12) # tickfont
                       ), # xaxis
            yaxis=dict(title='<b></b>',
                       color='orange',
                       autorange='reversed',
                       showline=False,
                       showgrid=False,
                       showticklabels=True,
                       linecolor='orange',
                       linewidth=1,
                       ticks='outside',
                       tickfont=dict(
                           family='Aerial',
                           color='orange',
                           size=12) # tickfond
                       ) # yaxis

        ) # Layout
    } # return if

    elif radio_items1 == 'Region':
        return {
            'data': [
                go.Bar(
                    x    = sales4['Sales'],
                    y    = sales4['Region'],
                    text = sales4['Sales'],
                    texttemplate ='$' + '%{text:,.2s}',
                    textposition ='auto',
                    orientation  ='h',
                    marker=dict(color='#19AAE1'),
                    hoverinfo='text',
                    hovertext=
                    '<b>Year</b>: ' + sales4['Year'].astype(str) + '<br>' +
                    '<b>Segment</b>: ' + sales4['Segment'].astype(str) + '<br>' +
                    '<b>Region</b>: ' + sales4['Region'].astype(str) + '<br>' +
                    '<b>Sales</b>: $' + [f'{x:,.0f}' for x in sales4['Sales']] + '<br>'

                ),
            ], # data
        'layout': go.Layout(
            title={'text': 'Sales by Region' + ' ' + str((select_years)),
                   'y': 0.99,
                   'x': 0.5,
                   'xanchor': 'center',
                   'yanchor': 'top'},
            titlefont={'color': 'white',
                       'size': 12},
            font=dict(family='sans-serif',
                      color='white',
                      size=15),
            hovermode='closest',
            paper_bgcolor='#1f2c56',
            plot_bgcolor='#1f2c56',
            legend={'orientation': 'h',
                    'bgcolor': '#010915',
                    'xanchor': 'center', 'x': 0.5, 'y': -0.7},
            margin=dict(t=40, r=0),
            xaxis=dict(title='<b></b>',
                       color='orange',
                       showline=True,
                       showgrid=True,
                       showticklabels=True,
                       linecolor='orange',
                       linewidth=1,
                       ticks='outside',
                       tickfont=dict(
                           family='Aerial',
                           color='orange',
                           size=12) # tickfont
                       ), # xaxis
            yaxis=dict(title='<b></b>',
                       color='orange',
                       autorange='reversed',
                       showline=False,
                       showgrid=False,
                       showticklabels=True,
                       linecolor='orange',
                       linewidth=1,
                       ticks='outside',
                       tickfont=dict(
                           family='Aerial',
                           color='orange',
                           size=12) # tickfond
                       ) # yaxis

        ) # Layout
    } # return elif
- Layout에 관한 다양한 Parameters에 관한 설명은 다음 링크에서 참조한다.
(5) 도넛 그래프 추가
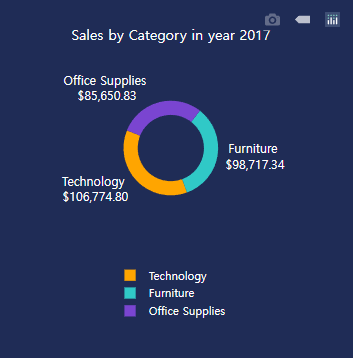
- 도넛 차트를 그리기 위해 우선 기본 골격을 만들도록 한다.
	...
				], className='create_container2 three columns', style={'height' : '400px'}), # (4) 가로형 막대 그래프

        # (5) 도넛 차트
        html.Div([
            dcc.Graph(id='donut_chart', config={'displayModeBar': 'hover'},
                      style={'height': '350px'})
        ], className='create_container2 three columns', style={'height': '400px'}), # (5) 도넛 차트
    ], className='row flex-display')
], id = "mainContainer", style={'display' : "flex", "flex-direction" : "column"}) # app.layout = html.Div
- 기존 그래프와 마찬가지로 callback 함수를 작성한다.
...

# 그래프 작성 구간 (Callback), # (5) 도넛 차트
@app.callback(Output('donut_chart', 'figure'),
              [Input('select_years', 'value')],
              [Input('radio_items', 'value')])
def update_graph(select_years, radio_items):
    sales5 = sales.groupby(['Year', 'Category', 'Segment'])['Sales'].sum().reset_index()
    sales_furniture = \
    sales5[(sales5['Year'] == select_years) & (sales5['Segment'] == radio_items) & (sales5['Category'] == 'Furniture')][
        'Sales'].sum()
    sales_Office = sales5[(sales5['Year'] == select_years) & (sales5['Segment'] == radio_items) & (
                sales5['Category'] == 'Office Supplies')]['Sales'].sum()
    sales_Technology = sales5[
        (sales5['Year'] == select_years) & (sales5['Segment'] == radio_items) & (sales5['Category'] == 'Technology')][
        'Sales'].sum()
    colors = ['#30C9C7', '#7A45D1', 'orange']

    return {
        'data': [go.Pie(
            labels=['Furniture', 'Office Supplies', 'Technology'],
            values=[sales_furniture, sales_Office, sales_Technology],
            marker=dict(colors=colors),
            hoverinfo='label+value+percent',
            textinfo='label+value',
            texttemplate='%{label} <br>$%{value:,.2f}',
            textposition='auto',
            textfont=dict(size=13),
            hole=.7,
            rotation=160,
            # insidetextorientation= 'radial'

        )],

        'layout': go.Layout(
            title={'text': 'Sales by Category in year' + ' ' + str((select_years)),
                   'y': 0.93,
                   'x': 0.5,
                   'xanchor': 'center',
                   'yanchor': 'top'},
            titlefont={'color': 'white',
                       'size': 15},
            font=dict(family='sans-serif',
                      color='white',
                      size=12),
            hovermode='closest',
            paper_bgcolor='#1f2c56',
            plot_bgcolor='#1f2c56',
            legend={'orientation': 'h',
                    'bgcolor': '#1f2c56',
                    'xanchor': 'center', 'x': 0.5, 'y': -0.7}

        )
    }

if __name__ == "__main__":
    app.run_server(debug=True)
(6) 선 그래프 추가
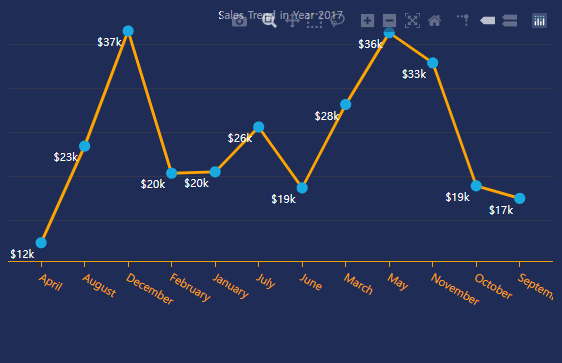
- 선 그래프를 추가하는 코드를 작성하기 위한 기본 골격을 작성한다.
...
				], className='create_container2 three columns', style={'height': '400px'}),  # (5) 도넛 차트

        # (6) 라인 그래프
        html.Div([
            dcc.Graph(id='line_chart', config={'displayModeBar': 'hover'},
                      style={'height': '350px'})

        ], className='create_container2 four columns', style={'height': '400px'}),  # (6) 라인 그래프
- 기존 그래프와 마찬가지로 callback 함수를 작성한다.
...
# 그래프 작성 구간 (Callback), # (6) 라인 그래프
@app.callback(Output('line_chart', 'figure'),
              [Input('select_years', 'value')],
              [Input('radio_items', 'value')])
def update_graph(select_years, radio_items):
    sales6 = sales.groupby(['Year', 'Month', 'Segment'])['Sales'].sum().reset_index()
    sales7 = sales6[(sales6['Year'] == select_years) & (sales6['Segment'] == radio_items)]

    return {
        'data': [
            go.Scatter(
                x=sales7['Month'],
                y=sales7['Sales'],
                text=sales7['Sales'],
                texttemplate='$' + '%{text:,.2s}',
                textposition='bottom left',
                mode='markers+lines+text',
                line=dict(width=3, color='orange'),
                marker=dict(color='#19AAE1', size=10, symbol='circle',
                            line=dict(color='#19AAE1', width=2)),
                hoverinfo='text',
                hovertext=
                '<b>Year</b>: ' + sales7['Year'].astype(str) + '<br>' +
                '<b>Month</b>: ' + sales7['Month'].astype(str) + '<br>' +
                '<b>Segment</b>: ' + sales7['Segment'].astype(str) + '<br>' +
                '<b>Sales</b>: $' + [f'{x:,.0f}' for x in sales7['Sales']] + '<br>'

            ),

        ],

        'layout': go.Layout(
            title={'text': 'Sales Trend in Year' + ' ' + str((select_years)),
                   'y': 0.99,
                   'x': 0.5,
                   'xanchor': 'center',
                   'yanchor': 'top'},
            titlefont={'color': 'white',
                       'size': 12},
            font=dict(family='sans-serif',
                      color='white',
                      size=12),
            hovermode='closest',
            paper_bgcolor='#1f2c56',
            plot_bgcolor='#1f2c56',
            legend={'orientation': 'h',
                    'bgcolor': '#010915',
                    'xanchor': 'center', 'x': 0.5, 'y': -0.7},
            margin=dict(t=5, l=0, r=0),
            xaxis=dict(title='<b></b>',
                       color='orange',
                       showline=True,
                       showgrid=False,
                       showticklabels=True,
                       linecolor='orange',
                       linewidth=1,
                       ticks='outside',
                       tickfont=dict(
                           family='Aerial',
                           color='orange',
                           size=12
                       )),
            yaxis=dict(title='<b></b>',
                       color='orange',
                       showline=False,
                       showgrid=True,
                       showticklabels=False,
                       linecolor='orange',
                       linewidth=1,
                       ticks='outside',
                       tickfont=dict(
                           family='Aerial',
                           color='orange',
                           size=12
                       )
                       )

        )
    }

if __name__ == "__main__":
    app.run_server(debug=True)
(7) 텍스트 추가
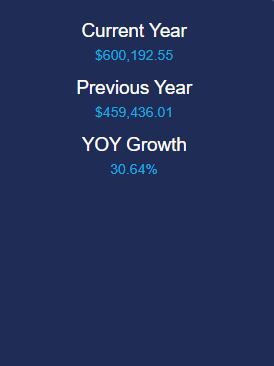
- KPI를 작성하는 Layout을 추가한다.
- Dive 태그 안에, 텍스트가 업데이트 될 Div가 추가가 된 것을 기억한다.
...
    ], className='create_container2 four columns', style={'height': '400px'}),  # (6) 라인 그래프

        # (7) 연도별 주요 지표
        html.Div([
            html.Div(id='text1'),
            html.Div(id='text2'),
            html.Div(id='text3'),

        ], className='create_container2 two columns'),  # 연도별 주요 지표

    ], className='row flex-display'),  # 상위 Div

...
- 이번에는 Callback 구문을 작성한다. 여기에서 주목해야 하는 것은
html.P관련 코드이다. Pandas 라이브러리를 통해 집계한 값을 각각html.P값에 추가하였다.
...
# (7) KPI 주요 지표
@app.callback(Output('text1', 'children'),
              [Input('select_years', 'value')])
def update_graph(select_years):
    sales8 = sales.groupby(['Year'])['Sales'].sum().reset_index()
    current_year = sales8[(sales8['Year'] == select_years)]['Sales'].sum()

    return [

        html.H6(children='Current Year',
                style={'textAlign': 'center',
                       'color': 'white'}),

        html.P('${0:,.2f}'.format(current_year),
               style={'textAlign': 'center',
                      'color': '#19AAE1',
                      'fontSize': 15,
                      'margin-top': '-10px'})

    ]

@app.callback(Output('text2', 'children'),
              [Input('select_years', 'value')])
def update_graph(select_years):
    sales10 = sales.groupby(['Year'])['Sales'].sum().reset_index()
    sales10['PY'] = sales10['Sales'].shift(1)
    previous_year = sales10[(sales10['Year'] == select_years)]['PY'].sum()

    return [

        html.H6(children='Previous Year',
                style={'textAlign': 'center',
                       'color': 'white'}),

        html.P('${0:,.2f}'.format(previous_year),
               style={'textAlign': 'center',
                      'color': '#19AAE1',
                      'fontSize': 15,
                      'margin-top': '-10px'})

    ]

@app.callback(Output('text3', 'children'),
              [Input('select_years', 'value')])
def update_graph(select_years):
    sales11 = sales.groupby(['Year'])['Sales'].sum().reset_index()
    sales11['YOY Growth'] = sales11['Sales'].pct_change()
    sales11['YOY Growth'] = sales11['YOY Growth'] * 100
    growth_year = sales11[(sales11['Year'] == select_years)]['YOY Growth'].sum()

    return [

        html.H6(children='YOY Growth',
                style={'textAlign': 'center',
                       'color': 'white'}),

        html.P('{0:,.2f}%'.format(growth_year),
               style={'textAlign': 'center',
                      'color': '#19AAE1',
                      'fontSize': 15,
                      'margin-top': '-10px'})

    ]
...
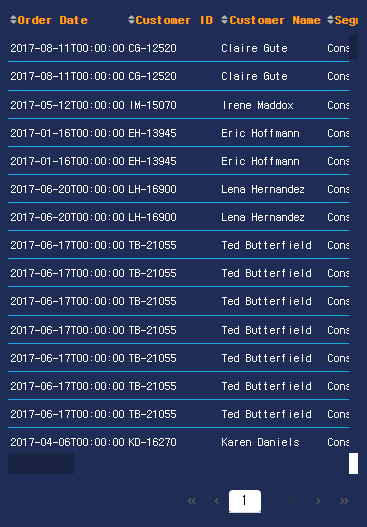
(8) 테이블 추가
- 이번에는 그래프가 아닌 Table을 추가하는 코드를 작성한다.
- Div 태그 안에, 텍스트가 업데이트 될 Div가 추가가 된 것을 기억한다.
- 이번에는 Div 태그를 분리해야 한다. 1행, 2행으로 분리해야 한다.
- Dash 테이블을 참조한다.
import dash_table as dt
...
				# (7) 연도별 주요 지표
        html.Div([
            html.Div(id='text1'),
            html.Div(id='text2'),
            html.Div(id='text3'),

        ], className='create_container2 two columns'),  # 연도별 주요 지표

		], className='row flex-display'),  # 상위 Div
		# 하위 Div
    html.Div([

        # (8) 테이블 생성
        html.Div([
            dt.DataTable(id='my_datatable',
                         columns=[{'name': i, 'id': i} for i in
                                  sales.loc[:, ['Order Date', 'Customer ID', 'Customer Name',
                                                'Segment', 'City', 'State', 'Region',
                                                'Category', 'Sub-Category', 'Product Name',
                                                'Sales', 'Year', 'Month']]],
                         virtualization=True,
                         style_cell={'textAlign': 'left',
                                     'min-width': '100px',
                                     'backgroundColor': '#1f2c56',
                                     'color': '#FEFEFE',
                                     'border-bottom': '0.01rem solid #19AAE1'},
                         style_header={'backgroundColor': '#1f2c56',
                                       'fontWeight': 'bold',
                                       'font': 'Lato, sans-serif',
                                       'color': 'orange',
                                       'border': '#1f2c56'},
                         style_as_list_view=True,
                         style_data={'styleOverflow': 'hidden', 'color': 'white'},
                         fixed_rows={'headers': True},
                         sort_action='native',
                         sort_mode='multi')
        ], className='create_container2 three columns'),  # 테이블 생성
...
], id="mainContainer", style={'display': "flex", "flex-direction": "column"})  # app.layout = html.Div
- 이번에는 Callback을 작성한다.
# (8) 테이블 생성
@app.callback(Output('my_datatable', 'data'),
              [Input('select_years', 'value')],
              [Input('radio_items', 'value')])
def update_graph(select_years, radio_items):
    data_table = sales[(sales['Year'] == select_years) & (sales['Segment'] == radio_items)]
    return data_table.to_dict('records')
(9) 가로형 막대 그래프
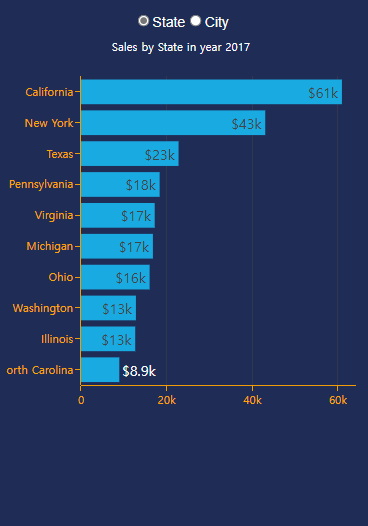
- 이번에는 State, City와 관련된 막대 그래프를 작성한다. 먼저 골격을 우선 작성한다.
				], className='create_container2 three columns'),  # 테이블 생성

        # (9) 가로형 막대 그래프 (State, City)
        html.Div([
            dcc.RadioItems(id='radio_items2',
                           labelStyle={'display': 'inline-block'},
                           value='State',
                           options=[{'label': 'State', 'value': 'State'},
                                    {'label': 'City', 'value': 'City'}],
                           style={'text-align': 'center', 'color': 'white'},
                           className='dcc_compon'),

            dcc.Graph(id='bar_chart_2', config={'displayModeBar': 'hover'}, ),
        ], className='create_container2 three columns'),  # 가로형 막대 그래프
- 이번에는 Callback 함수를 작성한다.
...
# (9) 막대형 차트
@app.callback(Output('bar_chart_2', 'figure'),
              [Input('select_years', 'value')],
              [Input('radio_items', 'value')],
              [Input('radio_items2', 'value')])
def update_graph(select_years, radio_items, radio_items2):
    sales12 = sales.groupby(['Year', 'State', 'Segment'])['Sales'].sum().reset_index()
    sales13 = sales12[(sales12['Year'] == select_years) & (sales12['Segment'] == radio_items)].sort_values(by=['Sales'],
                                                                                                           ascending=False).nlargest(
        10, columns=['Sales'])
    sales14 = sales.groupby(['Year', 'City', 'Segment'])['Sales'].sum().reset_index()
    sales15 = sales14[(sales14['Year'] == select_years) & (sales14['Segment'] == radio_items)].sort_values(by=['Sales'],
                                                                                                           ascending=False).nlargest(
        10, columns=['Sales'])

    if radio_items2 == 'State':
        return {
            'data': [
                go.Bar(
                    x=sales13['Sales'],
                    y=sales13['State'],
                    text=sales13['Sales'],
                    texttemplate='$' + '%{text:,.2s}',
                    textposition='auto',
                    orientation='h',
                    marker=dict(color='#19AAE1'),
                    hoverinfo='text',
                    hovertext=
                    '<b>Year</b>: ' + sales13['Year'].astype(str) + '<br>' +
                    '<b>Segment</b>: ' + sales13['Segment'].astype(str) + '<br>' +
                    '<b>State</b>: ' + sales13['State'].astype(str) + '<br>' +
                    '<b>Sales</b>: $' + [f'{x:,.0f}' for x in sales13['Sales']] + '<br>'

                ),

            ],

            'layout': go.Layout(
                title={'text': 'Sales by State in year' + ' ' + str((select_years)),
                       'y': 0.99,
                       'x': 0.5,
                       'xanchor': 'center',
                       'yanchor': 'top'},
                titlefont={'color': 'white',
                           'size': 12},
                font=dict(family='sans-serif',
                          color='white',
                          size=15),
                hovermode='closest',
                paper_bgcolor='#1f2c56',
                plot_bgcolor='#1f2c56',
                legend={'orientation': 'h',
                        'bgcolor': '#010915',
                        'xanchor': 'center', 'x': 0.5, 'y': -0.7},
                margin=dict(t=40, r=0),
                xaxis=dict(title='<b></b>',
                           color='orange',
                           showline=True,
                           showgrid=True,
                           showticklabels=True,
                           linecolor='orange',
                           linewidth=1,
                           ticks='outside',
                           tickfont=dict(
                               family='Aerial',
                               color='orange',
                               size=12
                           )),
                yaxis=dict(title='<b></b>',
                           color='orange',
                           autorange='reversed',
                           showline=False,
                           showgrid=False,
                           showticklabels=True,
                           linecolor='orange',
                           linewidth=1,
                           ticks='outside',
                           tickfont=dict(
                               family='Aerial',
                               color='orange',
                               size=12
                           )
                           )

            )
        }

    elif radio_items2 == 'City':

        return {
            'data': [
                go.Bar(
                    x=sales15['Sales'],
                    y=sales15['City'],
                    text=sales15['Sales'],
                    texttemplate='$' + '%{text:,.2s}',
                    textposition='auto',
                    orientation='h',
                    marker=dict(color='#19AAE1'),
                    hoverinfo='text',
                    hovertext=
                    '<b>Year</b>: ' + sales15['Year'].astype(str) + '<br>' +
                    '<b>Segment</b>: ' + sales15['Segment'].astype(str) + '<br>' +
                    '<b>City</b>: ' + sales15['City'].astype(str) + '<br>' +
                    '<b>Sales</b>: $' + [f'{x:,.0f}' for x in sales15['Sales']] + '<br>'

                ),

            ],

            'layout': go.Layout(
                title={'text': 'Sales by City in year' + ' ' + str((select_years)),
                       'y': 0.99,
                       'x': 0.5,
                       'xanchor': 'center',
                       'yanchor': 'top'},
                titlefont={'color': 'white',
                           'size': 12},
                font=dict(family='sans-serif',
                          color='white',
                          size=15),
                hovermode='closest',
                paper_bgcolor='#1f2c56',
                plot_bgcolor='#1f2c56',
                legend={'orientation': 'h',
                        'bgcolor': '#010915',
                        'xanchor': 'center', 'x': 0.5, 'y': -0.7},
                margin=dict(t=40, r=0),
                xaxis=dict(title='<b></b>',
                           color='orange',
                           showline=True,
                           showgrid=True,
                           showticklabels=True,
                           linecolor='orange',
                           linewidth=1,
                           ticks='outside',
                           tickfont=dict(
                               family='Aerial',
                               color='orange',
                               size=12
                           )),
                yaxis=dict(title='<b></b>',
                           color='orange',
                           autorange='reversed',
                           showline=False,
                           showgrid=False,
                           showticklabels=True,
                           linecolor='orange',
                           linewidth=1,
                           ticks='outside',
                           tickfont=dict(
                               family='Aerial',
                               color='orange',
                               size=12
                           )
                           )

            )
        }

if __name__ == "__main__":
    app.run_server(debug=True)
(10) 버블 차트 (Bubble Chart)
- Sales에 대한 각 월별 버블 차트를 작성해본다.
...
		], className='create_container2 three columns'),  # 가로형 막대 그래프

        # (10) 산점도 그래프
        html.Div([
            dcc.Graph(id='bubble_chart', config={'displayModeBar': 'hover'}, )
        ], className='create_container2 six columns', style={'width': '930px'})

    ], className='row flex-display')  # 산점도 그래프

], id="mainContainer", style={'display': "flex", "flex-direction": "column"})  # app.layout = html.Div
- 이번에는 Callback 함수를 작성한다.
...

# (10) 산점도 그래프
@app.callback(Output('bubble_chart', 'figure'),
              [Input('select_years', 'value')],
              [Input('radio_items', 'value')])
def update_graph(select_years, radio_items):
    sales16 = sales.groupby(['Year', 'Month', 'Segment', 'State', 'City'])['Sales'].sum().reset_index()
    sales18 = sales16[(sales16['Year'] == select_years) & (sales16['Segment'] == radio_items)]

    return {
        'data': [
            go.Scatter(
                x=sales18['Month'],
                y=sales18['Sales'],
                mode='markers',
                line=dict(width=3, color='orange'),
                marker=dict(color=sales18['Sales'],
                            colorscale='HSV',
                            showscale=False,
                            size=sales18['Sales'] / 250,
                            symbol='circle',
                            line=dict(color='MediumPurple', width=2)),
                hoverinfo='text',
                hovertext=
                '<b>Year</b>: ' + sales18['Year'].astype(str) + '<br>' +
                '<b>Month</b>: ' + sales18['Month'].astype(str) + '<br>' +
                '<b>Segment</b>: ' + sales18['Segment'].astype(str) + '<br>' +
                '<b>State</b>: ' + sales18['State'].astype(str) + '<br>' +
                '<b>City</b>: ' + sales18['City'].astype(str) + '<br>' +
                '<b>Sales</b>: $' + [f'{x:,.0f}' for x in sales18['Sales']] + '<br>'

            ),

        ],

        'layout': go.Layout(
            title={'text': 'Sales by state and city in Year' + ' ' + str((select_years)),
                   'y': 0.99,
                   'x': 0.5,
                   'xanchor': 'center',
                   'yanchor': 'top'},
            titlefont={'color': 'white',
                       'size': 12},
            font=dict(family='sans-serif',
                      color='white',
                      size=12),
            hovermode='closest',
            paper_bgcolor='#1f2c56',
            plot_bgcolor='#1f2c56',
            legend={'orientation': 'h',
                    'bgcolor': '#010915',
                    'xanchor': 'center', 'x': 0.5, 'y': -0.7},
            margin=dict(t=40, l=0, r=0),
            xaxis=dict(title='<b></b>',
                       color='orange',
                       showline=True,
                       showgrid=False,
                       showticklabels=True,
                       linecolor='orange',
                       linewidth=1,
                       ticks='outside',
                       tickfont=dict(
                           family='Aerial',
                           color='orange',
                           size=12
                       )),
            yaxis=dict(title='<b></b>',
                       color='orange',
                       showline=False,
                       showgrid=True,
                       showticklabels=False,
                       linecolor='orange',
                       linewidth=1,
                       ticks='outside',
                       tickfont=dict(
                           family='Aerial',
                           color='orange',
                           size=12
                       )
                       )

        )
    }

if __name__ == "__main__":
    app.run_server(debug=True)
References
-
Dash app layout and css file
-
dash html components
-
dash html components
-
dash basic callbacks
-
Indicator
-
pie chart
-
line chart
-
bar chart
-
Range slider
-
data table
-
marker style
-
bubble chart
