Heroku Dash App 배포 - Windows 10

개요

  • WindowsVirtualenv를 활용하여 빠르게 App 배포를 해본다.

1. 프로그램 다운로드

tutorial_01.png

  • 이럴 경우에는 환경변수를 강제로 잡는다.
C:\Program Files\heroku\bin
  • Heroku가 제대로 환경설정이 되어 있는지 확인하려면, 터미널에서 다음 명령어를 입력해 확인한다.
$ heroku -v
heroku/7.53.0 win32-x64 node-v12.21.0
(base)

2. Getting Started

$ heroku login
heroku: Press any key to open up the browser to login or q to exit:
Opening browser to https://cli-auth.heroku.com/auth/cli/browser/93982084-f22f-4a6b-b347-94f1aa4b6b47?requestor=SFMyNTY.g2gDbQAAAA4xMTIuMTQ0LjIyOC43Nm4GACiKMnR9AWIAAVGA.j9hng63oLOpCVOcHcWyOYDqT4s11jMHDtEesGw5xUD4
heroku: Waiting for login...
Logging in... done
Logged in as your_email@gmail.com
  • Github Repo를 생성하고, git clone 으로 바탕화면(또는 적정한 곳)에 Repo를 내려 받는다.
$ git clone https://github.com/your_name/heroku-app-green.git
  • heroku_app 경로에서 다음과 같이 실행한다.
    • 이 때, 프로젝트 폴더명, github repo 이름, heroku 이름이 동일해야 한다.
    • 또 한가지 주의해야 할 점은 name 방식이다. 무료 방식이기 때문에, 타 사용자가 해당 주소를 사용하고 있다면, 쓸수 없다. 또한, heroku_app 과 같은 형식도 되지 않는다.
    • 아래는 heroku app 생성 실패 내역이다.
$ heroku create heroku-app
 »   Warning: heroku update available from 7.53.0 to 7.59.2.
Creating heroku-app... !
 !    Name heroku-app is already taken                   
  • 정상적으로 설치가 완료되면 다음과 같이 뜬다.
$ heroku create heroku-app-green
 »   Warning: heroku update available from 7.53.0 to 7.59.2.
Creating heroku-app-green... done
https://heroku-app-green.herokuapp.com/ | https://git.heroku.com/heroku-app-green.git
(base)
  • heroku login을 진행한다.
$ heroku login
heroku: Press any key to open up the browser to login or q to exit: 
Opening browser to https://cli-auth.heroku.com/auth/cli/browser/9320abcd-b8c6-406d-9198-ca14d1e59a26?requestor=SFMyNTY.g2gDbQAAAA4yMjEuMTU3LjM3LjIxNm4GAGgtTBB7AWIAAVGA.GlyVc8jbyiW6NG0MVzCS0bOjtzBWvYRfjB9-gnkQaoQ
Logging in... done
Logged in as your_email_address
  • 이제 마지막으로 heroku app에 repository를 생성한다.
$ heroku git:remote -a your_app
 »   Warning: heroku update available from 7.53.0 to 7.59.2.
set git remote heroku to https://git.heroku.com/heroku-app-green.git
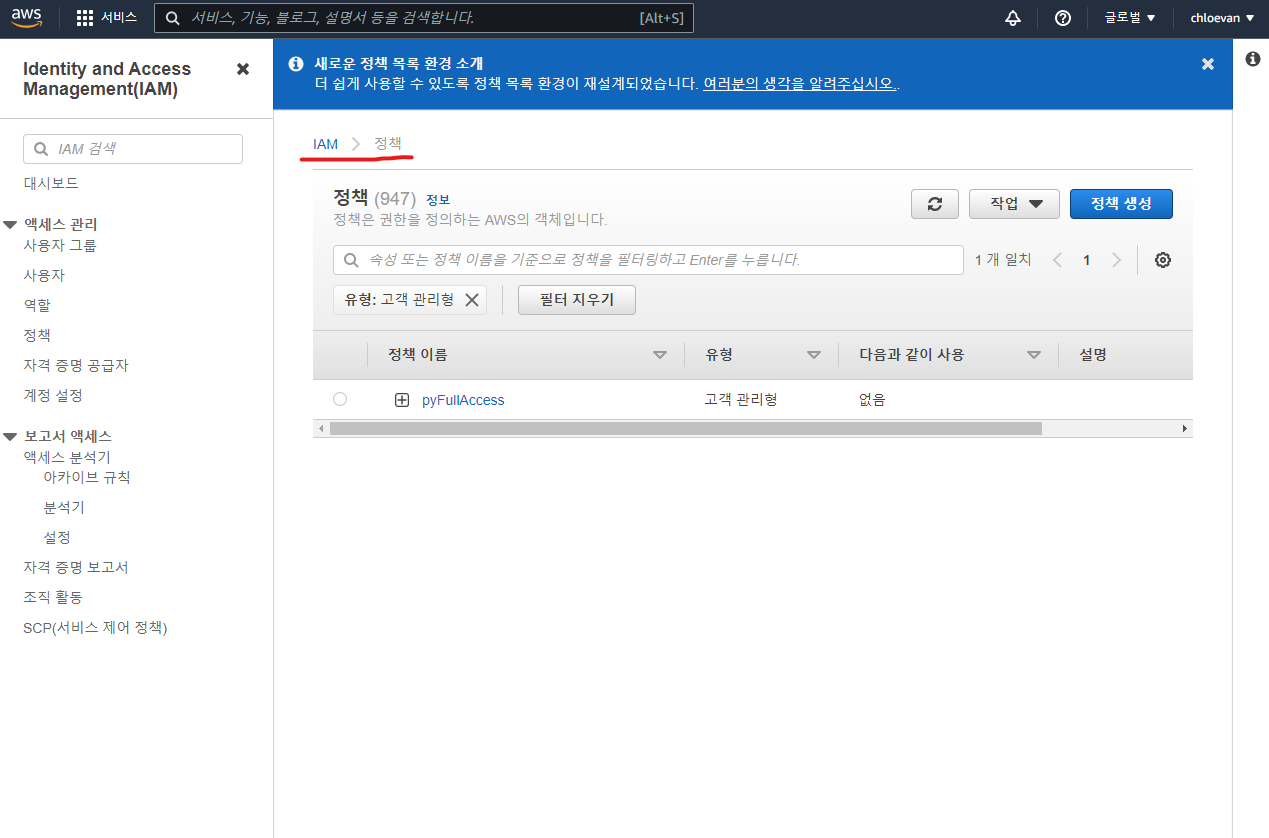
  • heroku-app-green 이 생긴 것을 확인할 수 있다.

tutorial_02.png

Hexo Blog 재연결

문제점

  • 몇몇 수강생이 노트북과 데스트탑 자리 모두에서 깃헙 블로그를 운영하고 싶어함.
  • 또한, 기존에 올라간 블로그 소스를 그대로 사용하고 싶어함.
  • 그런데, 제대로 반영이 안되는 경우가 있음.

해결책

  • 그런 경우 아래와 같이 순차적으로 진행하면 된다.
$ hexo init your_blog_repo # 여기는 각자 소스 레포 확인
$ cd myblog
$ git init 
$ git remote add origin https://github.com/your_name/your_blog_repo.git # 각자 소스 레포 주소
  • 아래 명령어에서 에러가 발생이 있다.
$ git pull --set-upstream origin main # 에러 발생
  • 그런 경우, 아래 명령어를 추가한다. 기존의 디렉토리와 파일을 모두 삭제한다는 뜻이다.
$ git clean -d -f
  • 그리고 에러가 발생했던 명령어를 다시 실행한다.
  • 이 때에는 이제 정상적으로 실행되는 것을 확인할 수 있다.
$ git pull --set-upstream origin main # 에러 발생 안함 / 소스 확인
  • 이제 정상적으로 환경 세팅은 된 것이다. 순차적으로 아래와 같이 진행하도록 한다.
    • 이 때, theme 폴더에 본인의 테마 소스코드가 잘 있는지 확인을 하도록 한다.
$ npm install 
$ hexo clean
$ hexo generate
$ hexo server

Kaggle Survey Data Transformation Tip

Intro

  • Data Transformation is always important to visualise.
  • Here, I just introduced to get value counts in different dataset.
  • If you are newbie, please be aware of this code before you dive into visualization.
# This Python 3 environment comes with many helpful analytics libraries installed
# It is defined by the kaggle/python Docker image: https://github.com/kaggle/docker-python
# For example, here's several helpful packages to load

import numpy as np # linear algebra
import pandas as pd # data processing, CSV file I/O (e.g. pd.read_csv)

# Input data files are available in the read-only "../input/" directory
# For example, running this (by clicking run or pressing Shift+Enter) will list all files under the input directory

import os
for dirname, _, filenames in os.walk('/kaggle/input'):
    for filename in filenames:
        print(os.path.join(dirname, filename))

# You can write up to 20GB to the current directory (/kaggle/working/) that gets preserved as output when you create a version using "Save & Run All" 
# You can also write temporary files to /kaggle/temp/, but they won't be saved outside of the current session
/kaggle/input/kaggle-survey-2021/kaggle_survey_2021_responses.csv
/kaggle/input/kaggle-survey-2021/supplementary_data/kaggle_survey_2021_methodology.pdf
/kaggle/input/kaggle-survey-2021/supplementary_data/kaggle_survey_2021_answer_choices.pdf

Data Import

  • Import raw data and split into questions dataset and survey dataset.
df = pd.read_csv("../input/kaggle-survey-2021/kaggle_survey_2021_responses.csv")
questions = df.iloc[0, :].T
questions
/opt/conda/lib/python3.7/site-packages/IPython/core/interactiveshell.py:3441: DtypeWarning: Columns (0,195,201,285,286,287,288,289,290,291,292) have mixed types.Specify dtype option on import or set low_memory=False.
  exec(code_obj, self.user_global_ns, self.user_ns)


Time from Start to Finish (seconds)                                Duration (in seconds)
Q1                                                           What is your age (# years)?
Q2                                                What is your gender? - Selected Choice
Q3                                             In which country do you currently reside?
Q4                                     What is the highest level of formal education ...
                                                             ...                        
Q38_B_Part_8                           In the next 2 years, do you hope to become mor...
Q38_B_Part_9                           In the next 2 years, do you hope to become mor...
Q38_B_Part_10                          In the next 2 years, do you hope to become mor...
Q38_B_Part_11                          In the next 2 years, do you hope to become mor...
Q38_B_OTHER                            In the next 2 years, do you hope to become mor...
Name: 0, Length: 369, dtype: object
df = df.iloc[1:, :]

Quick Data Review

  • All survey responses are count-based dataset.
  • It’s easy to check using value counts()
df['Q1'].value_counts()
25-29    4931
18-21    4901
22-24    4694
30-34    3441
35-39    2504
40-44    1890
45-49    1375
50-54     964
55-59     592
60-69     553
70+       128
Name: Q1, dtype: int64

Problem

  • Some questions are not easy to counts because of Supplementary Questions.
questions.index.tolist()[7:20]
['Q7_Part_1',
 'Q7_Part_2',
 'Q7_Part_3',
 'Q7_Part_4',
 'Q7_Part_5',
 'Q7_Part_6',
 'Q7_Part_7',
 'Q7_Part_8',
 'Q7_Part_9',
 'Q7_Part_10',
 'Q7_Part_11',
 'Q7_Part_12',
 'Q7_OTHER']
def sub_questions_count(question_num, part_num, text = False):
  part_questions = []

  if text in ["A", "B"]:
    part_questions = ['Q' + str(question_num) + "_" + text + '_Part_' + str(j) for j in range(1, part_num)]
    part_questions.append('Q' + str(question_num) + "_" + text + '_OTHER')
  else:
    part_questions = ['Q' + str(question_num) + '_Part_' + str(j) for j in range(1, part_num)]
    part_questions.append('Q' + str(question_num) + '_OTHER')

  # category count
  categories = []
  counts = []
  for i in part_questions:
    category = df[i].value_counts().index[0]
    val = df[i].value_counts()[0]
    categories.append(category)
    counts.append(val)

  combined_df = pd.DataFrame()
  combined_df['Category'] = categories
  combined_df['Count'] = counts

  combined_df = combined_df.sort_values(['Count'], ascending = False)
  return combined_df

Test

  • Case 1
# Test 
# 'Q38_B_Part_11',
print(sub_questions_count(38, 11, "B").reset_index(drop=True))
                  Category  Count
0             TensorBoard    4239
1                  MLflow    2747
2        Weights & Biases    1583
3              Neptune.ai    1276
4                 ClearML    1020
5                Polyaxon     737
6                Guild.ai     729
7    Domino Model Monitor     666
8                Comet.ml     633
9      Sacred + Omniboard     591
10                   Other    377

Case 2.

M1 Mac Tensorflow Installation in R

개요

  • M1 Mac에서 텐서플로를 설치 한다.
  • 필자의 현재 M1 환경은 아래와 같다.
sessionInfo()
R version 4.1.2 (2021-11-01)
Platform: aarch64-apple-darwin20 (64-bit)
Running under: macOS Big Sur 11.6

Matrix products: default
LAPACK: /Library/Frameworks/R.framework/Versions/4.1-arm64/Resources/lib/libRlapack.dylib

locale:
[1] en_US.UTF-8/en_US.UTF-8/en_US.UTF-8/C/en_US.UTF-8/en_US.UTF-8

attached base packages:
[1] stats     graphics  grDevices utils     datasets  methods   base     

other attached packages:
[1] ggplot2_3.3.5    dplyr_1.0.7      tfdatasets_2.7.0 keras_2.7.0     
[5] reticulate_1.22  tensorflow_2.7.0

loaded via a namespace (and not attached):
 [1] Rcpp_1.0.7        compiler_4.1.2    pillar_1.6.4      prettyunits_1.1.1
 [5] base64enc_0.1-3   tools_4.1.2       progress_1.2.2    digest_0.6.28    
 [9] zeallot_0.1.0     nlme_3.1-153      gtable_0.3.0      jsonlite_1.7.2   
[13] lifecycle_1.0.1   tibble_3.1.6      lattice_0.20-45   mgcv_1.8-38      
[17] pkgconfig_2.0.3   png_0.1-7         rlang_0.4.12      Matrix_1.3-4     
[21] cli_3.1.0         rstudioapi_0.13   withr_2.4.2       generics_0.1.1   
[25] vctrs_0.3.8       hms_1.1.1         rprojroot_2.0.2   grid_4.1.2       
[29] tidyselect_1.1.1  glue_1.5.0        here_1.0.1        R6_2.5.1         
[33] fansi_0.5.0       farver_2.1.0      purrr_0.3.4       magrittr_2.0.1   
[37] whisker_0.4       splines_4.1.2     scales_1.1.1      tfruns_1.5.0     
[41] ellipsis_0.3.2    colorspace_2.0-2  labeling_0.4.2    utf8_1.2.2       
[45] munsell_0.5.0     crayon_1.4.2 

Miniforge3 설치

Matplotlib 한글 폰트 추가 (Mac)

개요

  • Mac 유저를 위해 한글 폰트 추가하는 방법을 설명한다.
  • 기본 코드는 Windows에서도 동작한다.
  • 폰트 추가 방법은 생략한다.

한글 폰트 깨진 시각화

  • 간단하게 깨진 한글이 들어간 시각화를 구현한다.
import matplotlib.font_manager as fm
import matplotlib.pyplot as plt
import matplotlib as mpl
 
plt.plot([1, 2, 3, 4, 5])
plt.title("테스트")
plt.show()
/Library/Frameworks/Python.framework/Versions/3.8/lib/python3.8/site-packages/matplotlib/backends/backend_agg.py:238: RuntimeWarning: Glyph 53580 missing from current font.
  font.set_text(s, 0.0, flags=flags)
/Library/Frameworks/Python.framework/Versions/3.8/lib/python3.8/site-packages/matplotlib/backends/backend_agg.py:238: RuntimeWarning: Glyph 49828 missing from current font.
  font.set_text(s, 0.0, flags=flags)
/Library/Frameworks/Python.framework/Versions/3.8/lib/python3.8/site-packages/matplotlib/backends/backend_agg.py:238: RuntimeWarning: Glyph 53944 missing from current font.
  font.set_text(s, 0.0, flags=flags)
/Library/Frameworks/Python.framework/Versions/3.8/lib/python3.8/site-packages/matplotlib/backends/backend_agg.py:201: RuntimeWarning: Glyph 53580 missing from current font.
  font.set_text(s, 0, flags=flags)
/Library/Frameworks/Python.framework/Versions/3.8/lib/python3.8/site-packages/matplotlib/backends/backend_agg.py:201: RuntimeWarning: Glyph 49828 missing from current font.
  font.set_text(s, 0, flags=flags)
/Library/Frameworks/Python.framework/Versions/3.8/lib/python3.8/site-packages/matplotlib/backends/backend_agg.py:201: RuntimeWarning: Glyph 53944 missing from current font.
  font.set_text(s, 0, flags=flags)

png

RcppMeCab 패키지 설치 (Windows)

개요

  • Mecab-ko 형태소 분석기 사용 위해서는 Rcppmecab 패키지를 설치해야 함.
  • RcppMeCab 패키지 설치 앞서서 설치할 파일이 있음.

설치 파일

위 파일을 다운로드 받은 후, “C:\mecab"에서 압축을 해제한다.

MeCab_install_01.png

MeCab_install_02.png

RcppMecab 패키지 불러오기.

  • 이제 패키지를 불러오도록 한다.
  • 해당 패키지는 Github 버전으로 설치해야 하기 때문에 아래와 같이 설치를 한다.
library(remotes)
install_github("junhewk/RcppMeCab")
Downloading GitHub repo junhewk/RcppMeCab@HEAD
Installing 3 packages: BH, RcppParallel, Rcpp
.
.
** testing if installed package keeps a record of temporary installation path
* DONE (RcppMeCab)
library(RcppMeCab)

테스트

  • 실제 잘 실행되는지 테스트를 해본다.
library(remotes)
install_github("junhewk/RcppMeCab", force = TRUE)

library(RcppMeCab)

# 테스트
text = "안녕하세요!"
pos(sentence = text)
# $`�ȳ\xe7\xc7ϼ��\xe4!`
# [1] "�/SY"           "ȳ/SL"            "\xe7\xc7\xcf/SH" "���\xe4/SY"  
# [5] "!/SF" 
text2 = enc2utf8(text)

pos(sentence = text2)
# $`안녕하세요!`
# [1] "안녕/NNG"   "하/XSV"     "세요/EP+EF" "!/SF"

R 강의 소개

Python 강의 소개

Hexo Blog 이미지 추가

Hexo 이미지 추가

방법 1. Global Asset Folder

  • 가장 간편한 방법은 source 폴더 아래 images 폴더를 별도로 만든다.
  • 마크다운에서 아래와 같이 입력을 한다.
![](/images/image.jpg)


# hexo logo 테스트
- 이미지
![](/images/Hexo-logo.png)
  • hexo server를 실행한 뒤 결과를 확인한다.

result_01.png

Home Credit Default - Data Visualization

공지

  • 본 포스트는 재직자 교육을 위해 만든 강의안의 일부입니다.

Introduction

대회 개요

Many people struggle to get loans due to insufficient or non-existent credit histories. And, unfortunately, this population is often taken advantage of by untrustworthy lenders. Home Credit strives to broaden financial inclusion for the unbanked population by providing a positive and safe borrowing experience. In order to make sure this underserved population has a positive loan experience, Home Credit makes use of a variety of alternative data–including telco and transactional information–to predict their clients’ repayment abilities. While Home Credit is currently using various statistical and machine learning methods to make these predictions, they’re challenging Kagglers to help them unlock the full potential of their data. Doing so will ensure that clients capable of repayment are not rejected and that loans are given with a principal, maturity, and repayment calendar that will empower their clients to be successful.

tuber 패키지와 유투브 API를 활용한 Youtube 댓글 수집

공지

  • 본 자료는 아래 책에서 일부 발췌 하였고, 해당 코드를 재응용하기 위해 노력하였습니다. 전체 원 소스 코드를 보시려면 책을 구매하시기를 바랍니다.
  • 실무 예제로 끝내는 R 데이터 분석: 데이터 분석가에게 꼭 필요한 5가지 실무 예제로 분석 프로세스 이해하기

개요

  • Youtube API에 등록 후, 댓글 수집 및 감성을 분석하는 과정을 담았습니다.

구글 API 프로젝트 생성하기

  • 아래와 같이 새로운 프로젝트 만들기를 클릭 한다.

Classification with Tidymodels

개요

  • 새로운 ML 라이브러리인 tidymodels를 활용하여 분류 모델을 개발해본다.

데이터

Data Dictionary

  • Train 파일의 데이터 명세서는 다음과 같다.

  • Test 파일의 데이터 명세서는 다음과 같다.

  • Submission 파일의 데이터 명세서는 다음과 같다.

대회목적

  • 대출 승인 여부를 결정하는 모델을 만드는 것이 대회의 주 목적이며. 평가지표는 분류모형의 Accurarcy로 결정한다.

패키지 및 데이터 불러오기

  • 먼저 필수 패키지를 불러온다.
# 데이터 수집
library(readr)

# 데이터 가공
library(dplyr) # 데이터 가공
library(tidyr) # 컬럼 변경
library(stringr) # 문자열 데이터 다루기 
library(forcats) # 범주형 데이터 다루기
library(skimr) # 데이터 요약
library(magrittr) # 파이프라인 작성


# 데이터 시각화
library(ggplot2) # 데이터 시각화 
library(corrr) # 상관관계 시각화
library(skimr) # 데이터 요약
library(patchwork) # 데이터 시각화 분할
library(GGally) # 산점도

# 데이터 모델링
library(tidymodels) # ML Packages 
library(themis) # class imbalance 처리
library(discrim) # 베이지안 모델링
library(tidyposterior) # 베이지안 모델링 성능 비교
library(doParallel) # CPU cores 확인
  • 이번에는 데이터를 불러오도록 한다.
train = read_csv("data/train_ctrUa4K.csv")
## Rows: 614 Columns: 13
## ── Column specification ────────────────────────────────────────────────────────
## Delimiter: ","
## chr (8): Loan_ID, Gender, Married, Dependents, Education, Self_Employed, Pro...
## dbl (5): ApplicantIncome, CoapplicantIncome, LoanAmount, Loan_Amount_Term, C...
## 
## ℹ Use `spec()` to retrieve the full column specification for this data.
## ℹ Specify the column types or set `show_col_types = FALSE` to quiet this message.
train %<>% rename(Applicant_Income = ApplicantIncome,
                  CoApplicant_Income = CoapplicantIncome,
                  Loan_Amount = LoanAmount) 

loan_id = train$Loan_ID
train %<>% select(-Loan_ID) %>% mutate(Credit_History = as.character(Credit_History))
str(train)
## tibble [614 × 12] (S3: tbl_df/tbl/data.frame)
##  $ Gender            : chr [1:614] "Male" "Male" "Male" "Male" ...
##  $ Married           : chr [1:614] "No" "Yes" "Yes" "Yes" ...
##  $ Dependents        : chr [1:614] "0" "1" "0" "0" ...
##  $ Education         : chr [1:614] "Graduate" "Graduate" "Graduate" "Not Graduate" ...
##  $ Self_Employed     : chr [1:614] "No" "No" "Yes" "No" ...
##  $ Applicant_Income  : num [1:614] 5849 4583 3000 2583 6000 ...
##  $ CoApplicant_Income: num [1:614] 0 1508 0 2358 0 ...
##  $ Loan_Amount       : num [1:614] NA 128 66 120 141 267 95 158 168 349 ...
##  $ Loan_Amount_Term  : num [1:614] 360 360 360 360 360 360 360 360 360 360 ...
##  $ Credit_History    : chr [1:614] "1" "1" "1" "1" ...
##  $ Property_Area     : chr [1:614] "Urban" "Rural" "Urban" "Urban" ...
##  $ Loan_Status       : chr [1:614] "Y" "N" "Y" "Y" ...
  • 총 614개의 데이터에 13개의 컬럼이 있다.

탐색적 자료분석 (EDA)

  • 우선 skim() 함수를 활용하도록 한다.
skim(train)

Table: Data summary